
In today’s data-filled world there’s no longer any excuse for not knowing what your website visitors want – and then creating high-performing web content that delivers it to the letter. And that means using web analytics effectively.
Being able to reliably interpret web analytics data will give you a more thorough understanding of your website visitors and how they interact with your web pages. Deriving insights from your web analytics data is also essential for content optimization, improving the user experience, and gaining a competitive edge in search engines. Read on to learn how to make better, data-driven decisions about your content using web analytics insights.
Why use web analytics to make content decisions?
Web content should never operate in a silo. Every piece of content on your website should have a specific purpose, be measurable, and have a goal attached that links to your broader website and business objectives. These goals – also known as Key Performance Indicators (KPIs) – might include serving up relevant, useful information about your products or services, turning prospects into customers, or inspiring them to sign up to receive more content from you, such as a newsletter.
To realize these KPIs, your content needs to be high-quality, engaging, and meet visitor expectations. The best way of achieving this is by shining a light on how users interact with your pages and optimizing your web pages to meet their needs – and that requires accessing and interpreting reliable, actionable data. Without data, your content development and optimization process is simply a guessing game.
When combined, web analytics and carefully considered KPIs will help you measure the performance of your content and help you create incredibly valuable web pages that always hit the mark.

How to use Siteimprove Analytics to deliver a better content experience
Analytics platforms like Google Analytics can be confusing for marketers who aren’t analytics experts. Even those who consider themselves well-versed in analytics can find transforming raw data into actionable insights eats up time that could be better spent on creating and optimizing content. Collating data from multiple platforms is also resource-intensive, with the average marketer spending 3.55 hours a week on collecting, organizing, and analyzing data from different sources.
Alternative analytics platforms, like Siteimprove Analytics, have been designed for marketers that want fast, practical insights to inform their content strategy. Here’s how Siteimprove Analytics can help you make well-informed, data-driven content optimization choices that engage your target audience and boost sales, clicks, and conversions.
1. Establish a data-driven content culture
One obstacle that organizations often come across is tying content success to business outcomes. Implementing a data-driven approach will help you connect the dots between your content and the visitor actions that contribute to your business’s bottom line.
First, consider how your team measures content success. Metrics like the number of blog posts written or new pages published to your site are popular metrics, but they may not be the most optimal way of linking your content efforts to business outcomes. Instead, think about metrics like conversions, leads, and downloads. That is, quantifiable metrics that are tied more clearly to business objectives, growth, and revenue generation.
To get started, ask yourself:
- What are the business goals your content will support?
- How will you measure them?
Once you’ve answered these questions, it’s time to turn to Siteimprove Analytics. The ‘Key Metrics’ feature helps you do this by defining and tracking the metrics that matter most to your organization – all in one place. For those working with content, useful metrics to measure might include:
- Time spent on page
- Number of subscribers
- Newsletter sign-ups
- Email subscriptions
- Content downloads
- Live chat sessions
- Form completions
- Call-to-action clicks
- The point where visitors stop reading
Once you’ve established your metrics, it’s time to look at the ‘Key Performance Indicators (KPI)’ feature in Siteimprove Analytics. KPIs are groups of key metrics. Your team can use this feature to track and optimize the actions you want visitors to take on your web pages – for example, content engagement, which might be made up of a mix of content downloads, blog subscriptions, and social shares.
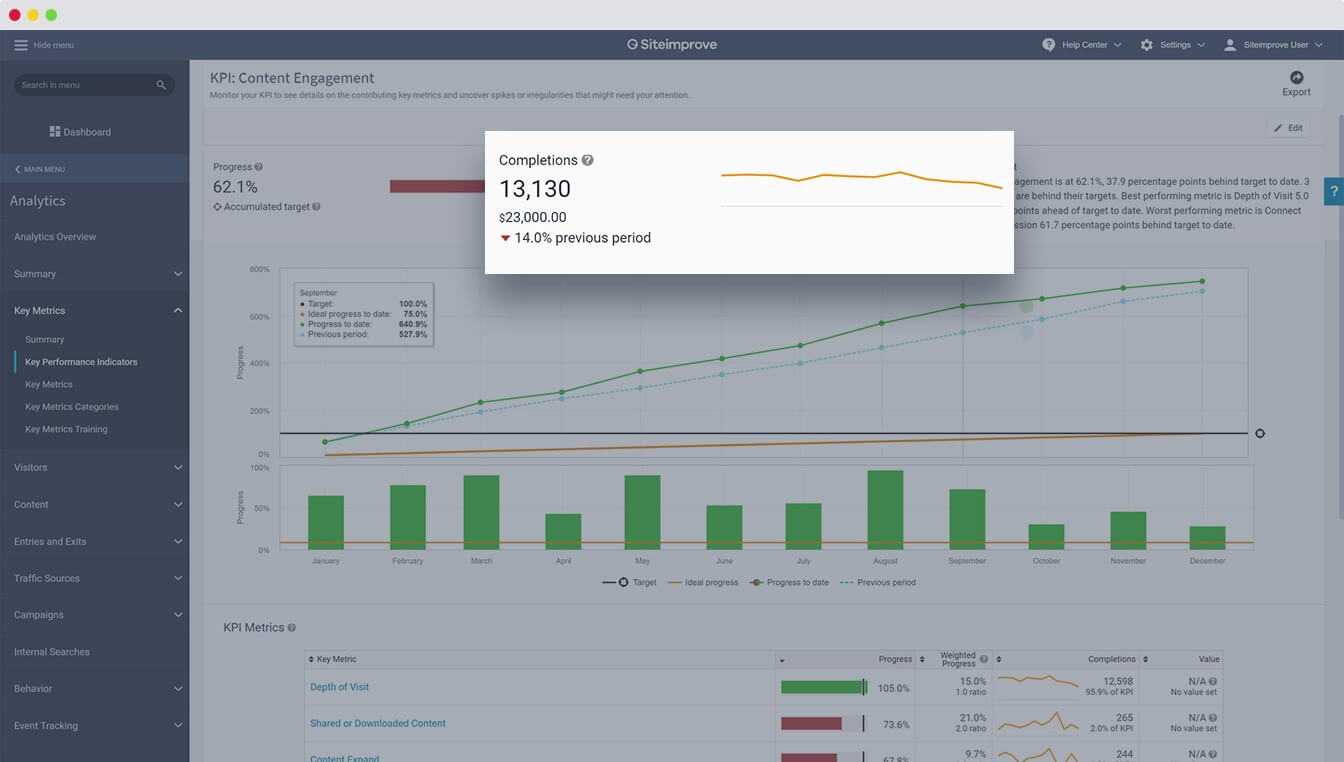
By carefully monitoring and analyzing your business goals and KPIs you can also spot areas which aren’t meeting expectations and swiftly rectify them. Use can also use this KPI data to report to management on the ongoing performance and return on investment of your content efforts in a clear, measurable fashion.
Tip: Assign an owner for each content KPI. When creating a KPI in Siteimprove Analytics, you will have the option to include who in your team is responsible for ensuring its success – and who will need to optimize it if it fails to perform as expected.
2. Get to know your audience
Before you can start optimizing your content, you need to understand your target audience. Fortunately, this is very simple with Siteimprove Analytics. For content creators, two sections will be especially important: Content and Visitors.
The Content Summary section is the best place to find high-level analytics information about your content, such as most popular pages, page load time, and pages with no visitors at all. It’s a useful jumping off point for different areas of Siteimprove Analytics that helps you drill down further into your content performance.
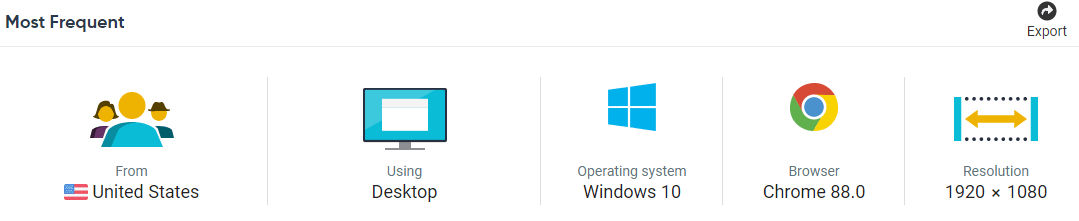
Then, put your visitors under a microscope with Visitor Summary. Jump into it to reveal:
- Their location
- The devices they use to access your content
- Their operating system
- Their browsers
- Their screen resolution
- The organization associated with their IP address
Action: Use this data to ensure your web pages provide a positive user experience for the type of visitor coming to your website. For example, if the majority of visitors interact with your website using a mobile device, it makes good sense to ensure your web pages are highly adapted to mobile browsing – after all, almost eight in 10 website visitors will stop engaging with content that doesn’t display well on their device and simply move on to a website that provides a better mobile user experience. Or if your visitors are based primarily in the UK, you might look to create more UK-centric content, or even create a UK-focused subdomain for your business.
3. Discover your most popular content – and draw lessons from your least
Now you know your target audience, it’s time to discover what content on your site is performing – and where you have room for improvement. To do this, you’ll need to learn which content topics and formats are popular among your audience.
Siteimprove Analytics’ Content section is where you find out how your visitors use your website, which content works well, and how to use those learnings to optimize your past and future content. It’s even possible to view the data from this feature directly in your CMS using the Siteimprove CMS plugin, meaning you can make edits as you go.
Here’s how to maximize your content optimization with the Content section of Siteimprove Analytics.
Content resources are often stretched, so how do you determine which content to focus on first for maximum impact? Start with ‘Most Popular Pages’ to concentrate your optimization efforts on the content that already delivers a valuable visitor experience.
You can get an even more comprehensive view of what sort of content you should avoid by diving into ‘Least Popular Pages’. This feature is also useful for locating content that should be archived from your site, or when selecting content to be eliminated or relocated during a site redesign.
‘Pages with No Visits’ highlights pages that have not received any visitor traffic. Use this section to work out why a page isn’t attracting visitors, for example, if it’s too hidden in the depths of your website’s hierarchy, has been excluded from search engine crawls, or is filled with outdated or irrelevant content. You can then eliminate these pages or work to improve their traffic by reviewing and updating their content, improving your cross-linking, or boosting their search engine discoverability.
One of the most effective ways of revealing what works – and doesn’t work – for your visitors is getting that information directly from them. Use Feedback Surveys to hear straight from the horse’s mouth about why your visitors are making the choices they do – along with gleaning ideas for enhancing their user experience and content needs.
4. Optimizing your content with visitor behavior analysis
Once you’ve located your content weak spots, you can optimize the user journey to prevent funnel leakage and develop content that resonates more strongly with your visitors. But how do you convert visitor behavior data into actionable content optimization tasks? Siteimprove Analytics has several visitor behavior analysis features that transform numbers into insights that your team can then use to influence on-page visitor behavior and increase successful outcomes across your KPIs.
Where do you begin? Determining the factors that most affect the user experience should be your first move. Visualizing the steps your website visitors take is a helpful way to uncover problematic conversion-blockers and other page elements that provide a less than stellar user experience and cause your visitors to drop out of your funnel.
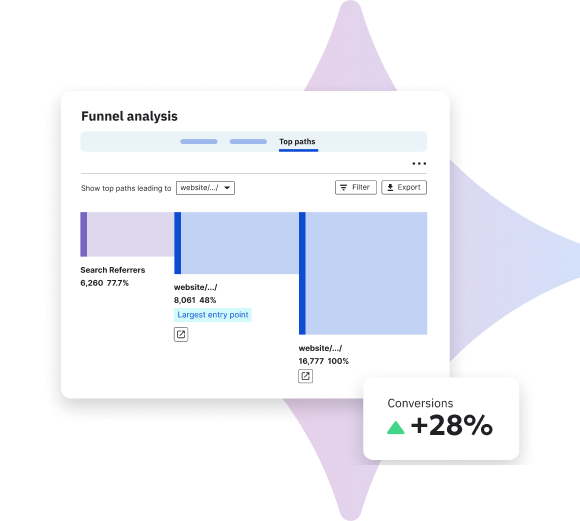
Funnels
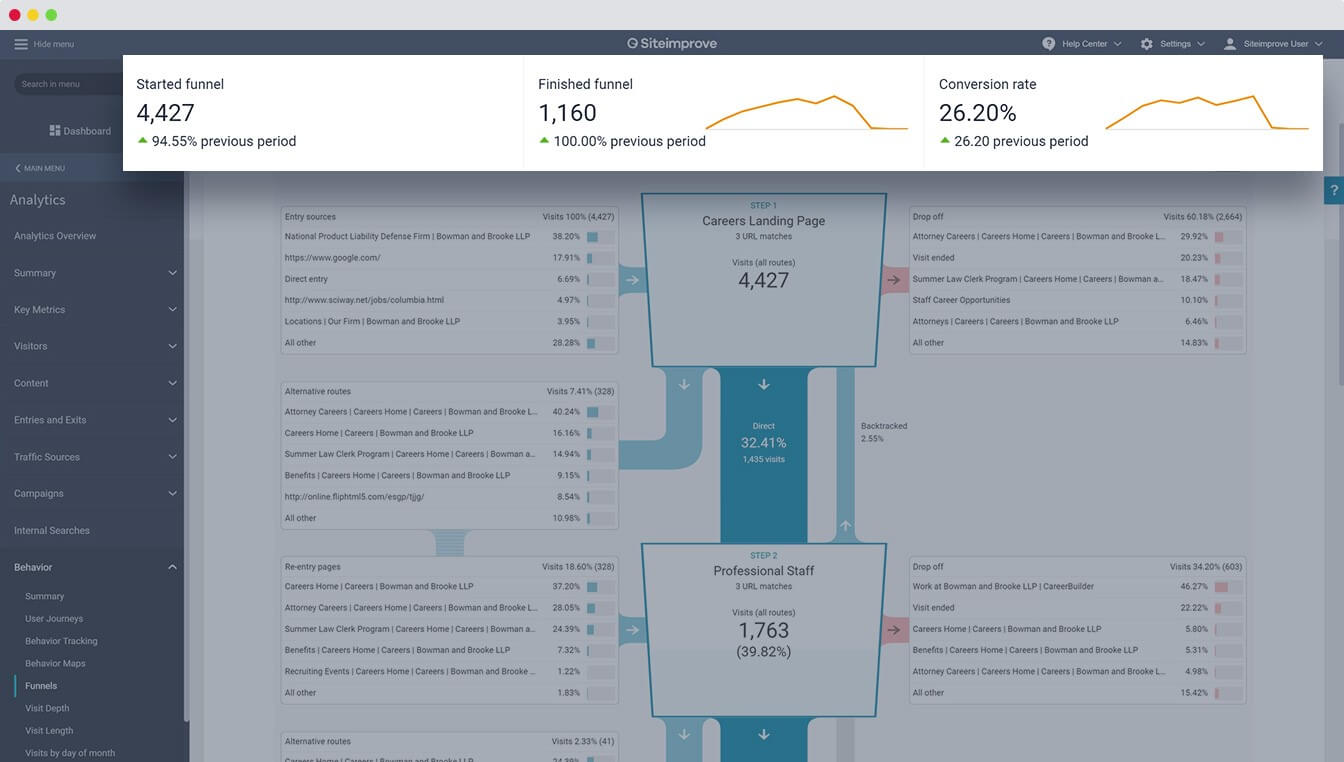
Use ’Funnels’ to gain a better understanding of the time it takes visitors to get to the point of conversion, the conversion rate itself, and exactly where your visitors are leaking out of the funnel. From here, it’s a case of filling in any content gaps, streamlining your navigation, and eliminating troublesome bottlenecks.
Behavior maps
Need to do a deeper dive into how you can improve your content to hit your metrics? Uncover how and why your visitors behave in a certain way with detailed behavior insights and analysis in the Behavior section.
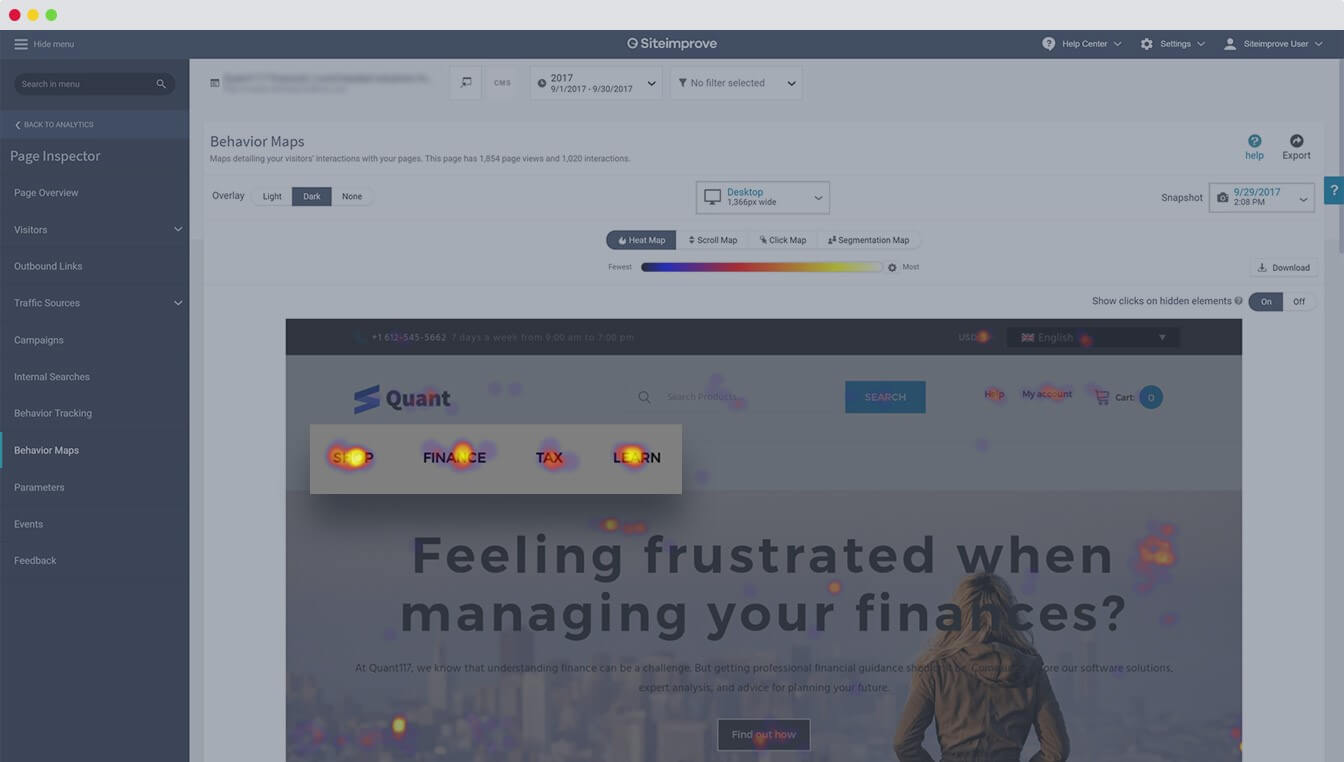
Understand exactly how your visitors interact with your content using ‘Behavior Maps’. Behavior Maps show you how and where visitors click, scroll, and interact with any page on your website. Use this information to reengineer your content to improve the user experience and boost conversions.
For example, if your call-to-action is located at the bottom of your blog posts, but you can see your visitors aren’t scrolling that far down, try relocating it and then monitor analytics for that page for any positive changes. You can then utilize the data from your Behavior Maps to measure the success of your content optimizations over time. If there are visible improvements, you can then proceed with implementing these updates sitewide.
Bounce rates
Pay close attention to the ‘Bounce Rates’ feature to identify underperforming pages that don’t meet visitor expectations. This feature tracks the number of visitors who viewed just a single page on your site before leaving. While this might be expected for a purely informational page, for pages with a business-critical call-to-action, a high bounce rate would be of concern and should be prioritized for optimization. Lowering your bounce rates could involve:
- Improving the trustworthiness of your page by eliminating content errors, such as broken links and misspellings.
- Ensuring your content closely matches the user’s intent and aligns with your page title.
- Enhancing your content’s readability. Try splitting long articles into multiple pages, using digestible content formatting like bulleted lists, headings and subheadings, videos, and suitable images, and ensure your content matches your target audience’s readability level.
- Speeding up your page load times.
- Improving your accessibility.
- Optimize for mobile.
- Enhancing your site navigation.
- Implementing more visible and compelling call-to-actions.
Visitor timings
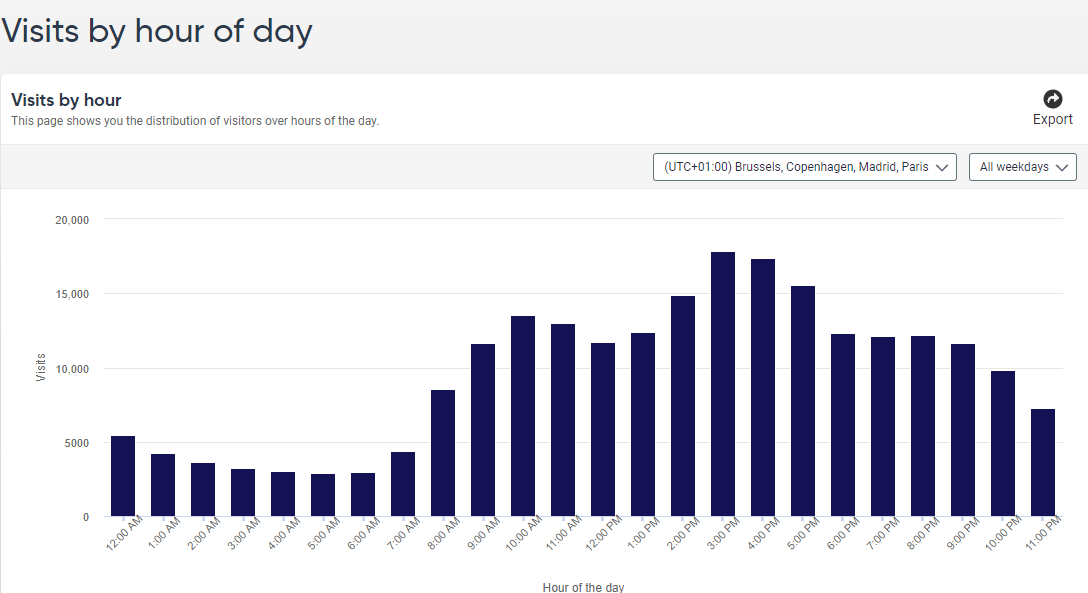
Knowing when you have the most – and least – visitors present on your site is useful data that you can apply to your posting schedule. For optimal results, examine ‘Visits by Weekdays’, or drill even deeper down with ‘Visits by Hour of Day’ to pinpoint the best times to upload new content to your site.
Site speed
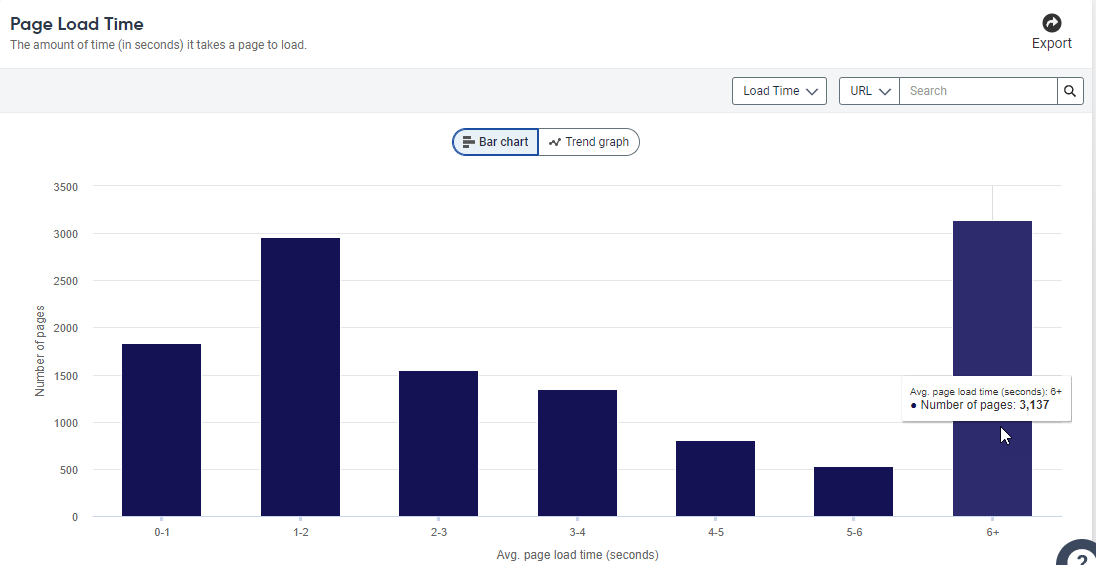
Site speed is another significant factor when it comes to providing a good user experience for your site visitors. In fact, with Google’s upcoming Core Web Vitals update, it will become a key page experience metric. Nearly half (40%) of visitors will abandon a web page after waiting for more than three seconds for it to load, so this is a great focus area for bringing down your bounce rates, boosting your search engine rankings, and driving conversions.
Examine the ‘Page Load Time’ feature to find out how long it takes your pages to load. Begin by optimizing your top-performing pages with the slowest loading times for maximum impact. If you’re already using Siteimprove Performance, you can use it to access detailed guidance for speeding up your most sluggish pages.
Content quality assurance
Remember, high-quality content is still the most important ranking factor for search engines, so it’s a good idea to run your content through a quality assurance checking tool, like Siteimprove Quality Assurance, to boost your chances in the search results pages and provide a highly relevant, good quality website experience. Check your content for the following conversion blockers:
- Misspellings that can damage your credibility
- Broken links that can disrupt the user journey
- Confusing, dense copy that doesn’t reflect your target visitor’s readability level
5. Tracking and sharing your content successes
You’ve finished optimizing your content and embedded analytics into your content development process, but your job still isn’t over. Regularly monitoring your content performance is essential for getting a clear understanding of what is working on your site and detecting content that requires further optimization.
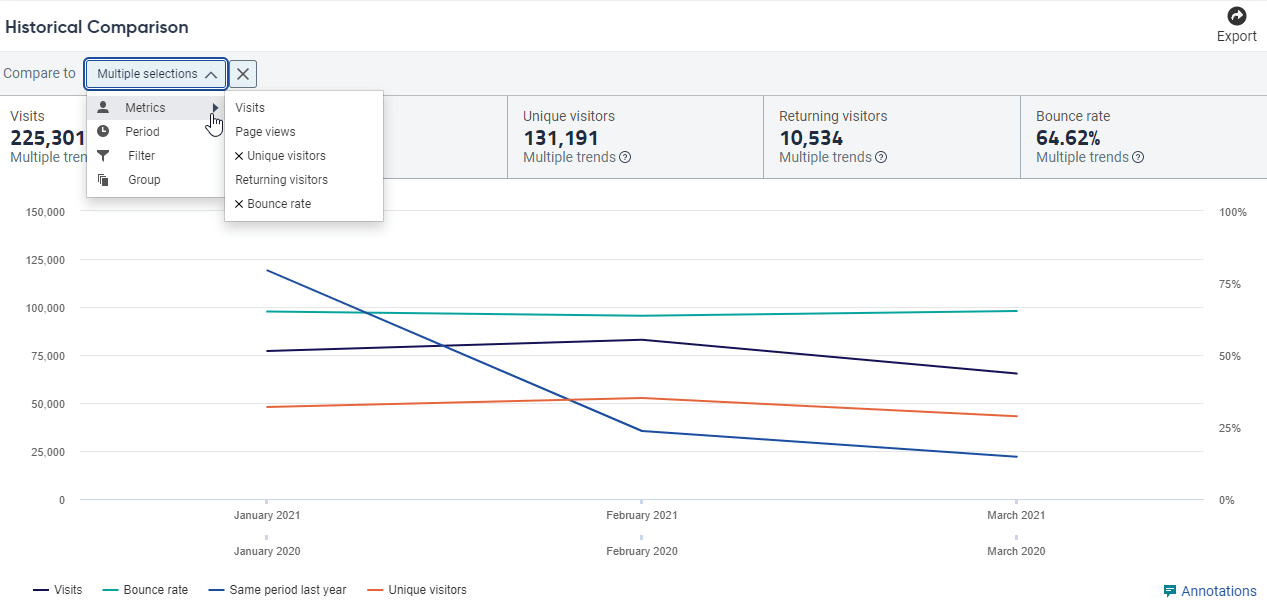
‘Historical Comparison’ can be a beneficial feature for measuring the performance of your content over time at a glance. Use it to compare sets of metrics across defined periods and show measurable improvements to your key metrics year-on-year, such as a reduction in bounce rates or an increase in returning visitors.
With Siteimprove Analytics, you can set up reports and send them automatically to all stakeholders – at your desired frequency. Choose from a standard Siteimprove report, customize your own, or tap into one of Siteimprove’s MarTech integrations.
6. Combine web analytics with your other website optimization efforts
Content marketers often wear multiple hats. That’s why Siteimprove Analytics is part of a wider web optimization platform, which also includes tools to help you with quality assurance, SEO, web accessibility, and other website optimization focus areas – all in one platform.
If you’re already using the Siteimprove Intelligence Platform, you can join-up your analytics insights and SEO efforts with Siteimprove SEO, to make sure your content is both data-driven and search engine-friendly. These insights are always tied to actionable tasks, helping to speed up delivery. Add in Siteimprove Quality Assurance to guarantee your site content is always high-quality, trustworthy, and error-free, and incorporate accessibility insights from Siteimprove Accessibility to ensure that your web pages are optimized for all your site visitors, including those with disabilities.
Enhance your MarTech stack with new Siteimprove analytics integrations: Google Analytics and Adobe Analytics
To give you even more choice when it comes to making data-driven content decisions, we’ve introduced two new analytics integrations to the Siteimprove family; Google Analytics and Adobe Analytics.
These integrations enable Siteimprove customers to decide which content issues to fix first based on the popularity of the pages where these issues occur. Speed up content decisions by viewing a handy ‘Page View’ column within your favorite Siteimprove tools, including Accessibility, Policy, and Quality Assurance. It’s also possible to see this data directly in your Siteimprove CMS plugin, making it even easier for you to act on Siteimprove insights, wherever works best for you.
Conclusion
If you aren’t measuring your content, you have no way of knowing what is and isn’t working. Using analytics insights not only helps you create informed, user-focused content, it also helps you successfully move your visitors through the funnel, boost conversions, and meet your business goals.
Whether you’re a beginner or an advanced user, Siteimprove Analytics enables you to work in a more structured, insights-driven way. Easy access to onboarding, in-tool tutorials, a help center, one-on-one support, and an online training academy ensures you’re always optimizing your content based on what really matters to search engines and your readers.
Ready to make the most out of your Web Analytics?
Siteimprove Analytics is an all-in-one Web Analytics solution
Schedule a demo