APP ANALYTICS SOFTWARE
Insights, across your mobile apps
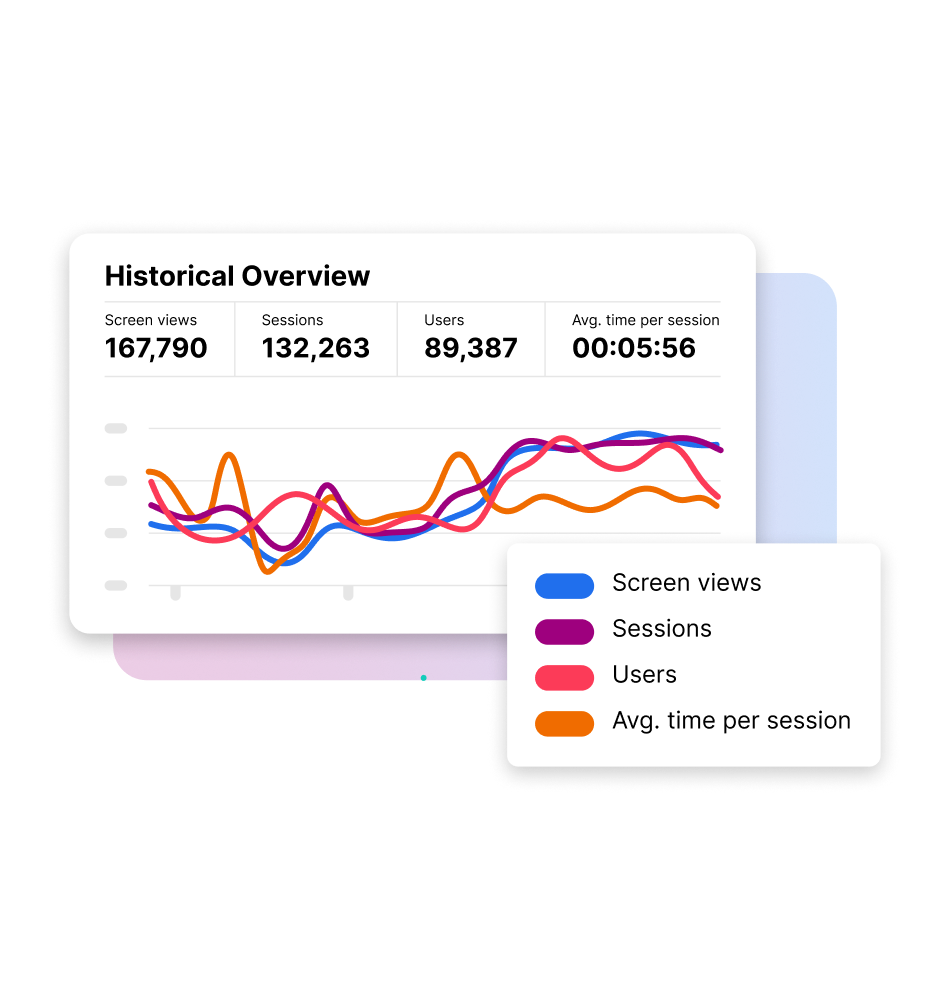
Get the full picture across your digital properties. Track and improve user engagement across both native apps and websites in one unified workspace, without juggling separate tools or data sources.
The strategic choice for mobile developers


Are you managing the analytics for your website and apps in separate tools?
For enterprise teams managing digital properties across web and native mobile apps, it’s important to ensure consistency and optimize the user experience in both environments.
App Analytics extends Siteimprove’s focus of simplifying digital optimization by bringing mobile app performance into the same platform that already powers web analytics, SEO, and Accessibility.
For the first time within Siteimprove, teams can track and improve user engagement across both native apps and websites in one unified workspace, without juggling separate tools or data sources.
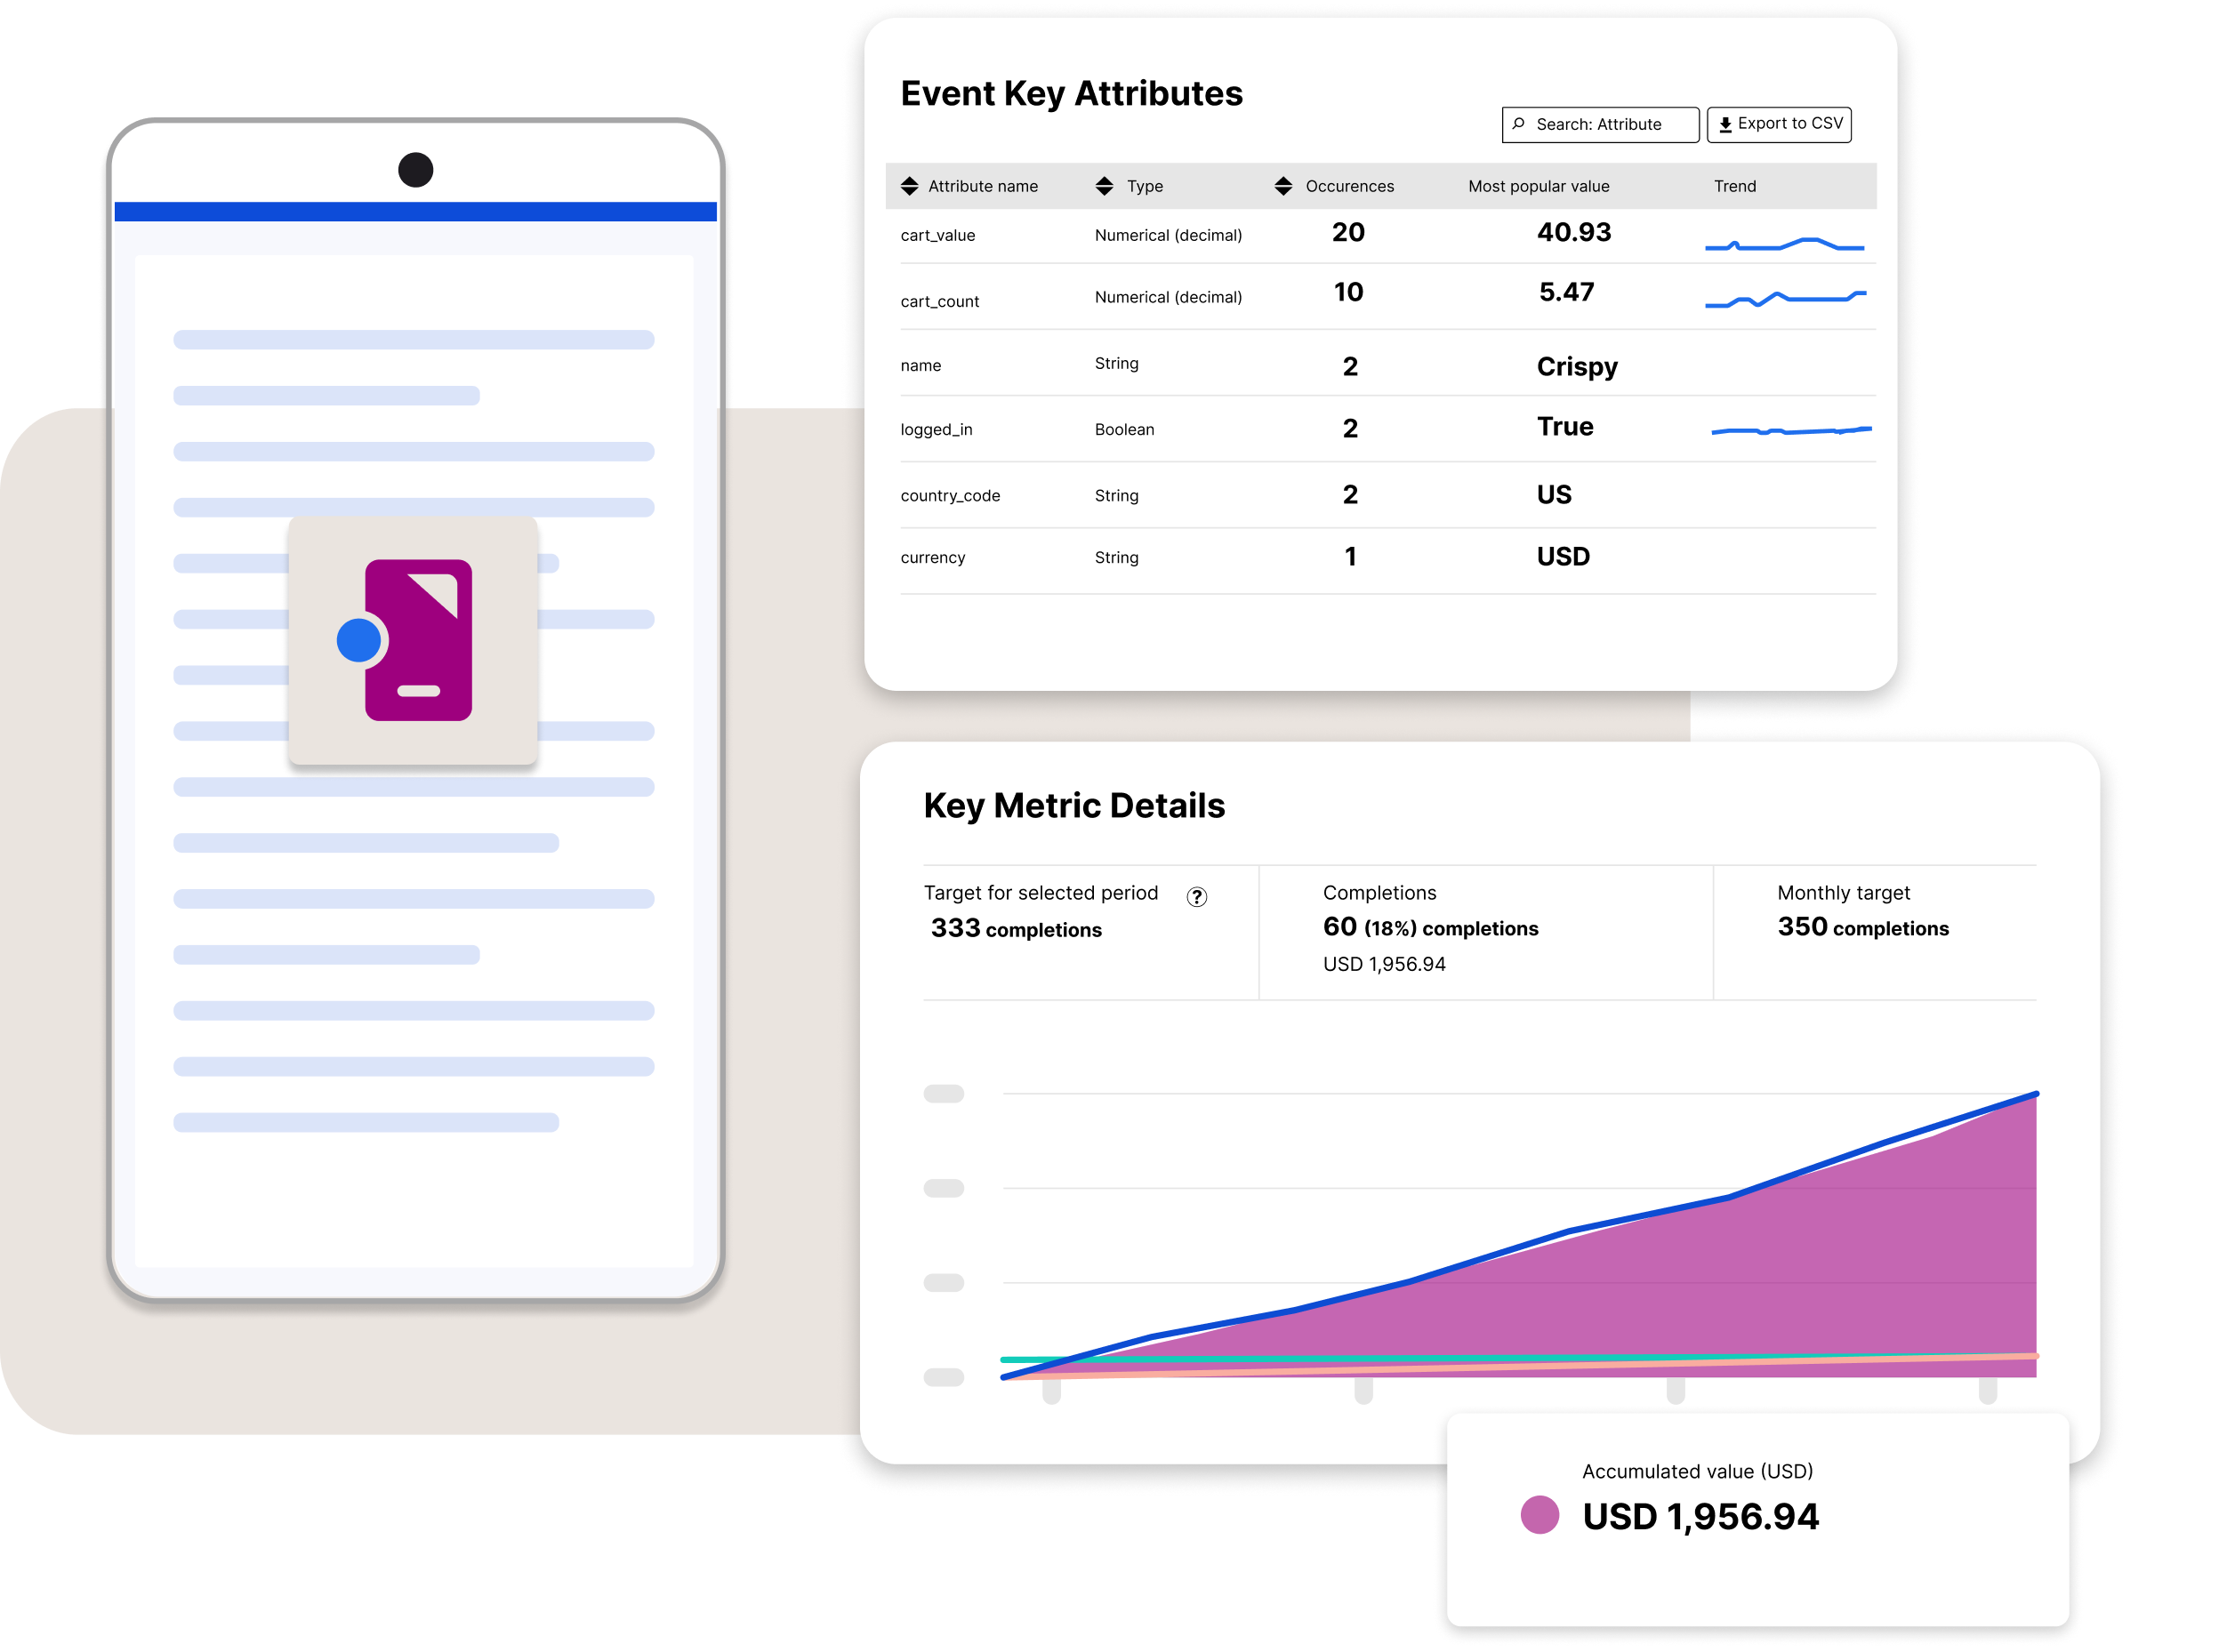
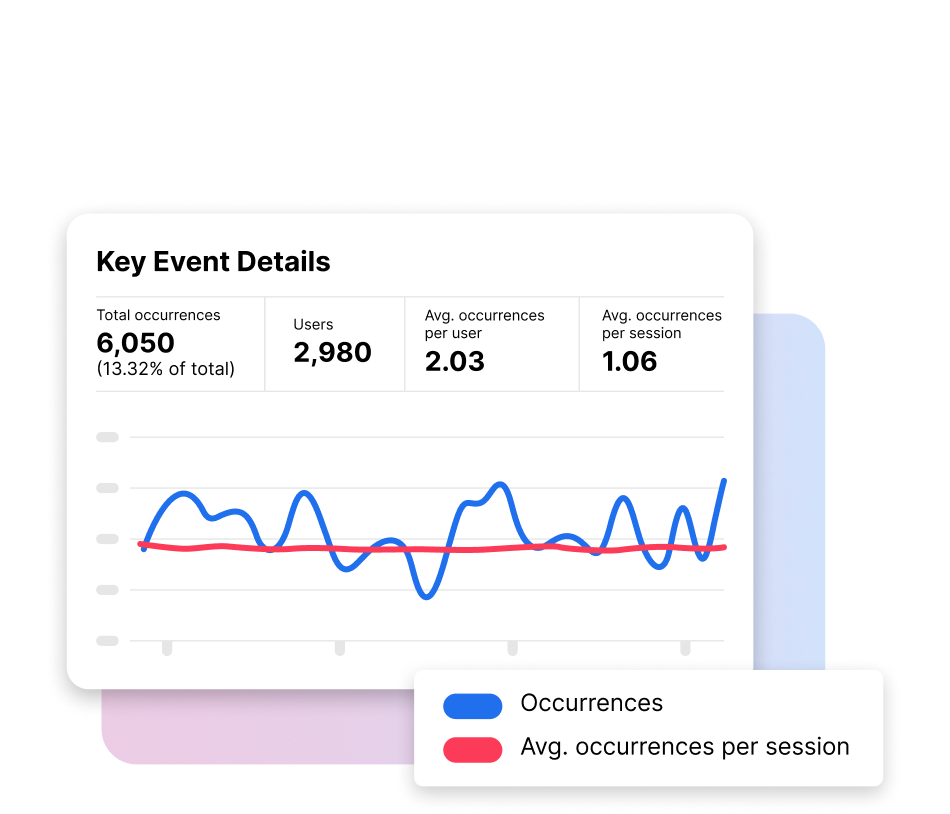
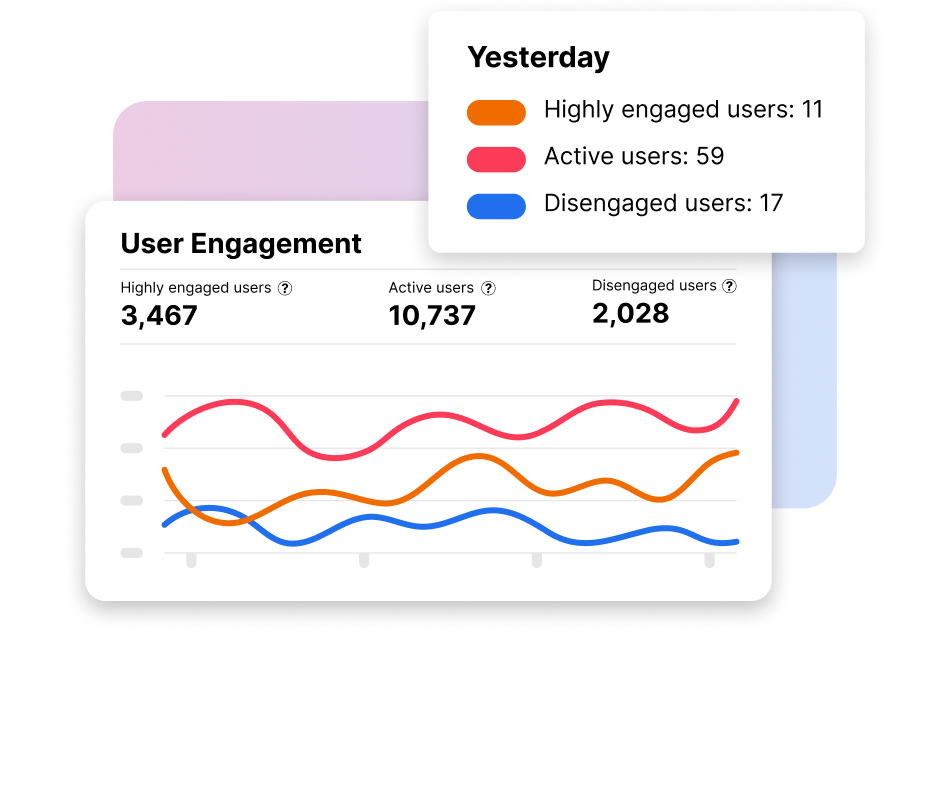
Dynamic event tracking and usage data for cross-functional digital teams
With centralized dashboards, measuring feature adoption, key metric conversion, retention, and overall user engagement within your app has never been easier.
Product teams
Understand feature adoption and retention to see how users are engaging with the parts of your app that matter. Make data-driven product improvement decisions.
Content writers
Measure how users engage with content in your mobile app, optimize messaging, improve consistency, and prove performance.
UX/UI designers
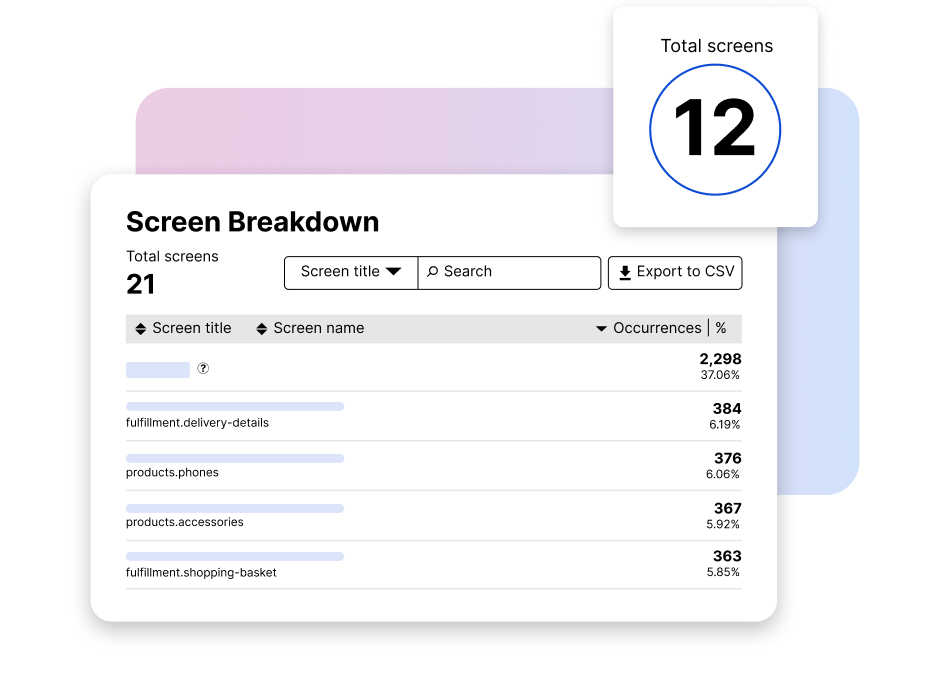
Understand how users interact with mobile app layouts and navigation, and validate whether screens are used as designed to identify opportunities to improve experience.
Mobile developers
Track screen-level performance in mobile apps the same way you track page-level performance on the web, including views, clicks, and navigation.
App Analytics FAQs
Mobile-only analytics tools are great for deep analysis of in-app behavior, but they leave you blind to the web half of the customer journey. Our platform is different because it provides a unified view, allowing you to see how users move between your website and your app. This is the only way to get a complete picture of user behavior and campaign performance across all your digital platforms.
Our SDK is lightweight and designed for easy implementation on both iOS and Android. We provide comprehensive documentation and dedicated, hands-on support to ensure your development team can get up and running quickly with minimal disruption.
Yes. By analyzing user cohorts and behavior funnels that track engagement over time, you can pinpoint exactly where users are dropping off or which features lead to the highest long-term value. These insights are critical for building a product experience that improves engagement and retention.
No, and that is the core value of our platform. We provide a single, unified interface where you can build dashboards and reports that combine your web and mobile app data. This allows you to track cross-platform KPIs and see your customer's complete journey in one place without needing to stitch reports together manually.