Are heatmaps part of your analytics strategy? These powerful analytics tools are missed by many digital marketers. Those who do utilize them, however, gain invaluable user traffic insights to guide their future digital marketing decisions.
If you’re new to heatmap analytics, today we’re going to focus solely on this tool so you can learn the tricks you need to make heatmaps a mainstay in your web analytics toolbox.
What are heatmaps and what information do they provide?
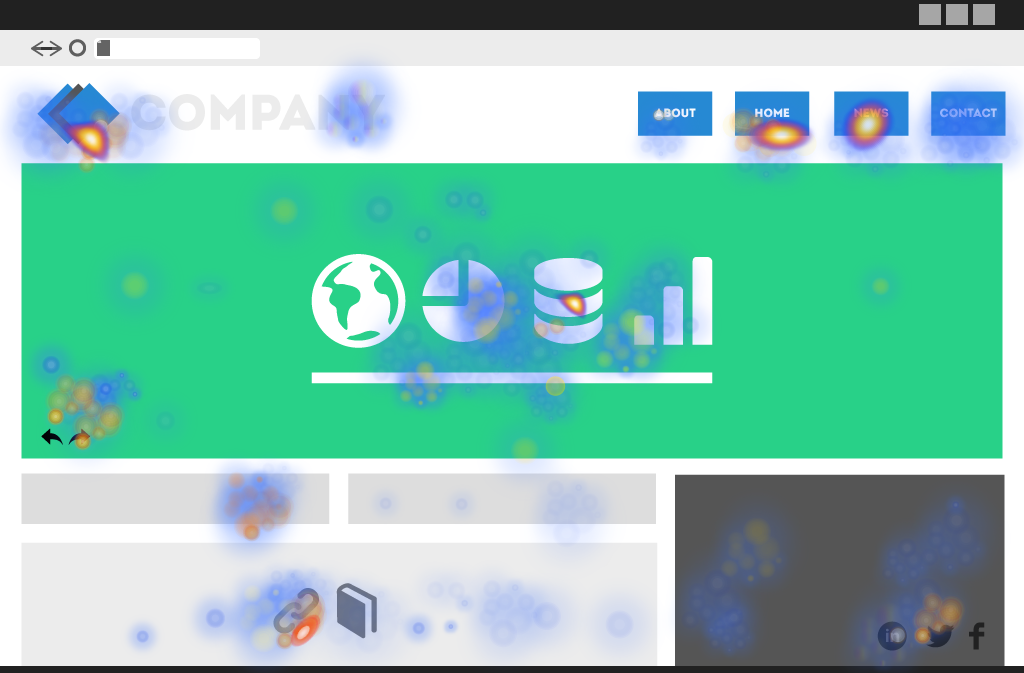
Simply put, heatmaps measure visitor usage habits on your website. The first heatmaps you review will look similar to ink blot paintings, but those colors hold valuable data.
Warm colors, like red, orange, and yellow, illustrate the areas of a web page that are drawing the highest user interaction and traffic. Meanwhile, cool colors, like green and blue, mark areas where traffic is less.
Understanding the different heatmaps
You may already employ conventional click and scroll maps to deliver data, but you can employ click and scroll heatmaps as well.
Click heatmaps prioritize areas of your web page based on user traffic from blue (coldest) to red (the warmest). Meanwhile scroll heatmaps provide a similar color radiant breakdown along the side of your webpage which you can use to determine how far down the page users are scrolling.
The third and final heatmap is the segmentation map. Segmentation heatmaps allow you to segment your users to compare behavior patterns on page. For instance, you may want to compare your social media users against your organic visitors or measure traffic coming to your site from the United States as opposed to another country.
Common errors to avoid when reading heatmaps
Warm colors good cool colors bad right? Actually, it’s not that simple and there are a few common errors many marketers make when reading their heat maps.
First of all, be mindful of your mobile vs. desktop traffic. This is important because elements of your web page may not appear in the same way on both versions of the web page. Fail to take this into account and you could be misinterpreting your data.
A second common error digital marketers make with segmentation maps is choosing the wrong segmentation categories. Perhaps your most important findings lie in comparing new versus returning visitors or you have failed to filter out visitors coming from your company’s own ID. Effectively segmenting your heat maps ahead of time removes these pollutants before they can foul up your data.
Lastly, be mindful of the time frame you allot for your analysis. Your chosen timeframe should be long enough to capture an effective amount of data – an overly short timeframe could cause the data to skew unfairly. You should also make sure your chosen timeframe includes periods before and after the change so you can monitor the effects.
How reading and interpreting heatmaps correctly can help your organizational processes
Alright, we’ve covered the different types of heatmaps and how to read them. Now let’s look at the ways in which the data you glean from your heatmaps can benefit your organization. It’s a lengthy list.
Heat map data can help you:
- Make data-driven website optimization decisions.
- Optimize your page templates for your targeted user segments
- Review the order of information on your landing pages. Is the key information up front? Scroll maps can tell you whether your site visitors are staying with your page throughout the most important information. If they aren’t, you may need to rework the page to get those vital portions higher up.
- Investigate your CTAs. Are they being used as you intended or are users clicking somewhere else? Are certain design elements distracting from your CTAs?
- Determine if your targeted segment has the intended behavior on your web pages. Using your segmentation maps, you’ll be able to determine if your web pages are drawing the desired audience and actions you intended.
- Test your navigation to improve user journeys. Are users following the path you’ve outlined? Your click maps can show you and help guide future changes.
- Review the placements of your internal links to ensure the most important links are drawing the attention they deserve.
- Optimize your conversion rates on your forms, shopping carts and other metrics by identifying and removing roadblocks.
Implement your heatmaps today
Redefine success metrics for your website by implementing a cohesive heatmaps strategy. It’s the best way to see where you stand and to monitor how even the most subtle website changes impact your users. And if you have any questions, contact us, we’re always here to help.