There’s no shortage of data. In fact, some might say there’s too much of it these days.
The hard part is knowing which data points matter.
For marketing teams, it’s easy to get buried in dashboards, reports, and KPIs that look impressive but don’t affect change. Some teams track countless marketing metrics that have little to do with their priorities.
Metrics only become meaningful when they help you make smart decisions. This means choosing the right metrics is almost as important as tracking them.
Metrics are most meaningful when they’re not isolated from each other. Siloed data is a marketer’s worst enemy because wrangling different data sets is inefficient and yields unreliable insights, not to mention causes enormous frustration.
What are digital marketing metrics?
Marketing metrics are the numbers that tell you how your efforts are performing. They show whether your marketing campaigns are driving traffic, engaging users, generating leads, or building brand awareness.
In other words, metrics translate your work into data you can measure and track.
Why are marketing metrics important?
Marketing metrics turn guesswork into strategy. They show you what’s driving results, whether it’s a campaign that boosted conversions or a piece of content that fell flat.
When you measure the right things, you can make confident decisions, adjust your tactics quickly, and show stakeholders the real impact of your work.
Goals before measurement
Too often, teams chase numbers like clicks or impressions that are easy to measure. But if those numbers don’t move the business forward, they’re just a distraction. Real performance comes from tracking the metrics that map to real business outcomes.
Before you start pulling reports, get clear on what you’re trying to achieve. Every campaign should tie back to a specific business goal.
For example, if your goal is to grow enterprise sales, tracking blog pageviews or social media engagement won’t tell you much. But monitoring demo requests, lead quality, and sales velocity will show whether your content is influencing the pipeline.
The point is to track the metrics for the things you're trying to achieve, not track everything.
Key marketing metrics you might track
As you can imagine, there are countless marketing metrics that might relate to your business goals. You don’t have to track them all, just the ones that are relevant to your goals.
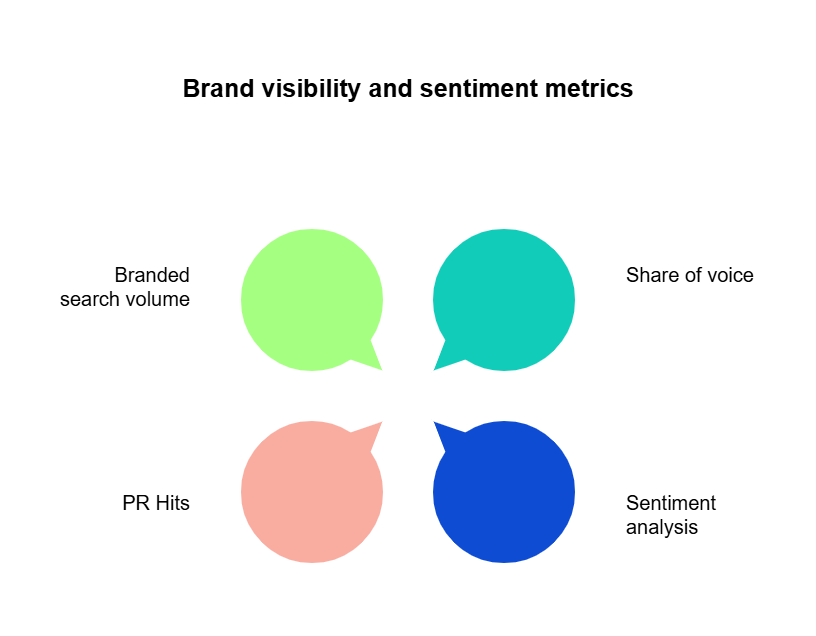
Brand visibility and sentiment
These metrics help you understand how visible your brand is in the market and how people feel about it. They’re especially useful for tracking awareness campaigns or monitoring your competitive position over time.
Branded search volume
This measures how often people search for your company name or branded products on search engines. A rise in branded search volume often indicates growing awareness or interest.
Formula: Total monthly searches for branded terms (e.g., your company name or specific product names), pulled from tools like Google Search Console.
Share of voice (SOV)
Share of voice tells you how much of the conversation your brand owns compared to competitors, across channels like search, social, and media.
Formula: (Your brand’s mentions or impressions / Total market mentions or impressions) × 100
Sentiment analysis
Sentiment analysis gauges whether public mentions of your brand are positive, negative, or neutral. It helps you track reputation and catch issues early.
Measured by: AI-powered tools that analyze tone in reviews, social posts, and news articles.
PR hits
This tracks the number of times your brand is mentioned in media coverage. It’s a simple way to measure earned media exposure and the reach of your PR efforts.
Measured by: Press monitoring tools that track media mentions across publications.
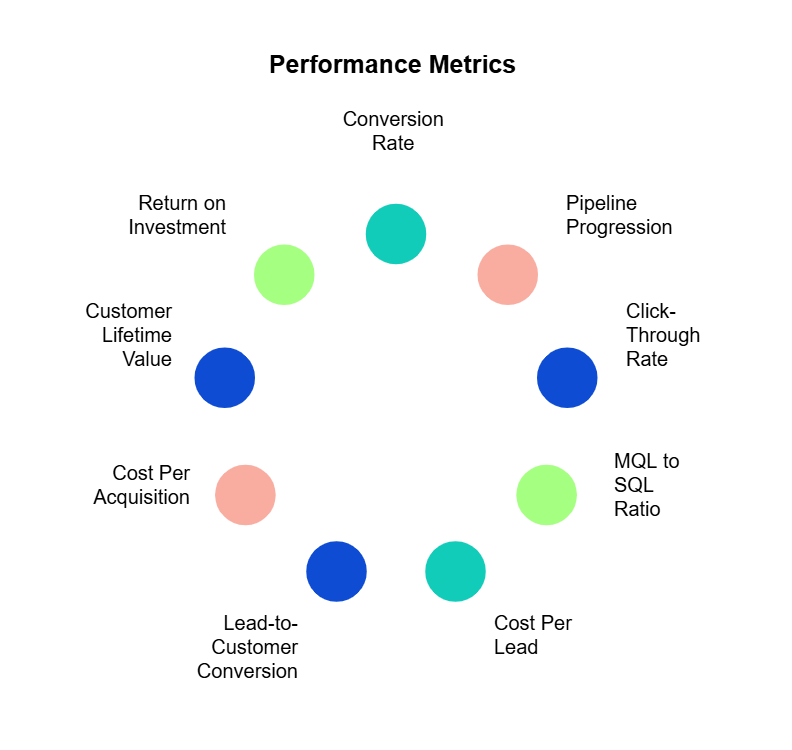
Performance metrics
These metrics show how well your marketing efforts drive real business outcomes. They help you evaluate whether your campaigns are attracting attention and moving people to act.
Conversion rate
Conversion rate measures the percentage of users who complete a desired action. Macro conversions are big goals like demo requests or purchases. Micro conversions are smaller steps like newsletter signups or resource downloads
Formula: (Conversions / Total visitors) × 100
Pipeline progression (close rate)
This tells you how effectively leads move through the marketing funnel and turn into customers. It’s key for connecting marketing to sales impact.
Formula: (Closed-won deals / Total opportunities) × 100
Click-through rate (CTR)
CTR shows how many people clicked on a specific link or call-to-action compared to how many saw it. It’s a quick read on message effectiveness.
Formula: (Clicks / Impressions) × 100
Marketing qualified lead (MQL) to sales qualified lead (SQL) ratio
This ratio shows how many of your marketing-qualified leads end up being accepted by sales. A healthy MQL-to-SQL ratio indicates alignment between marketing and sales teams.
Formula: Total SQLs / Total MQLs
Cost per lead (CPL)
CPL shows how much you’re spending to acquire each lead. It helps you measure the efficiency of lead generation efforts.
Formula: Total campaign cost / Number of leads generated
Lead-to-customer conversion rate
This tracks how many leads eventually turn into paying customers. It helps you assess the quality of your leads and the effectiveness of your funnel.
Formula: (Customers / Leads) × 100
Cost per acquisition (CPA)
CPA shows how much it costs to acquire one customer. It’s a critical metric for tracking campaign profitability.
Formula: Total campaign cost / Number of new customers acquired
Customer lifetime value (CLV)
CLV estimates how much revenue you can expect from a single customer over the course of the relationship. It helps you decide how much you can afford to spend to acquire and retain customers.
Formula: Average purchase value × Purchase frequency × Customer lifespan
Return on investment (ROI)
This important metric measures how much revenue your marketing generated compared to your marketing spend. It’s often the ultimate performance metric. You can measure this at the campaign level (like an email blast) or the program level (like your entire email marketing initiative).
Formula: (Revenue from campaign – Campaign cost) / Campaign cost × 100
Action completion
This measures how many users completed specific actions on your site or platform, such as downloading a file, submitting a form, starting a trial. These actions are often tied to micro conversions.
Measured by: Analytics events or goal completions in your reporting tools.
Multiple touchpoint attribution
This tracks how different marketing interactions contribute to a final conversion. It helps you understand which marketing channels or campaigns have the most impact throughout the customer journey.
Measured by: Attribution models in marketing analytics platforms (e.g., linear, time decay, data-driven).
Company-focused metrics
These are custom KPIs based on your specific goals, such as accounts engaged, target industry conversion rate, or deal size by vertical. They let you measure what matters most to your business model.
Measured by: Internal tracking aligned to company objectives.
SEO & content metrics
These metrics show how well your content marketing performs in search and how much organic value it brings to your site. They help you spot what’s driving visibility, what needs improvement, and where to double down.
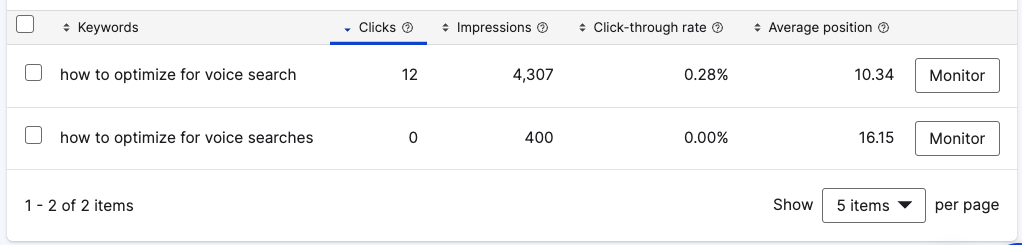
Impressions
Impressions track how often your pages appear in search results. High impressions with low clicks may mean your metadata or content needs work.
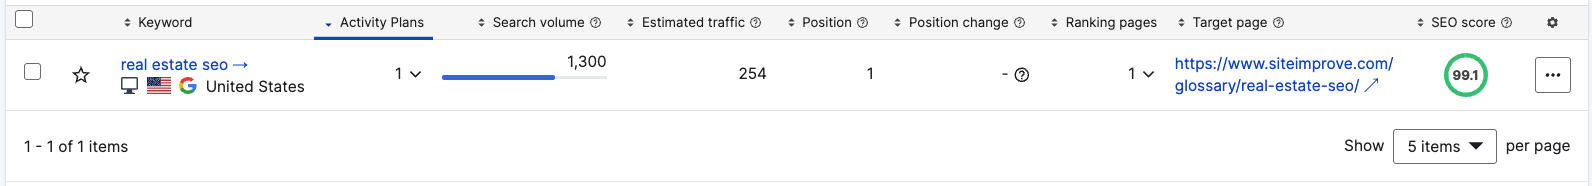
Keyword rankings
This shows where your pages rank in search results for specific keywords. Tracking keyword movement over time helps you measure SEO progress and content relevance.
Traffic growth
Organic traffic growth shows whether your SEO and content efforts are attracting more visitors over time. It’s one of the clearest indicators of long-term content success.
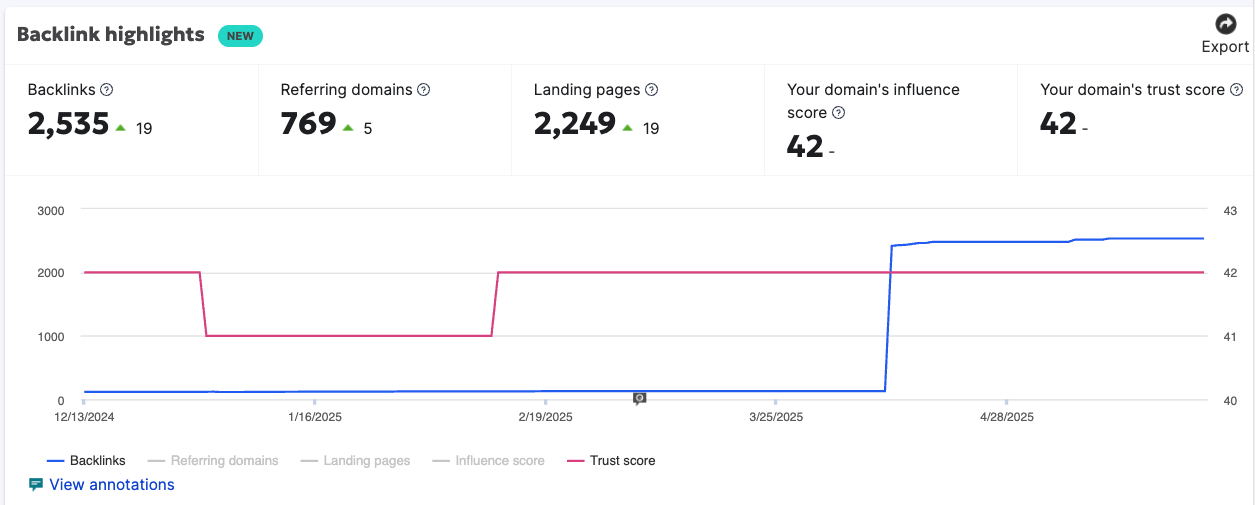
Backlinks
Backlinks are links from other websites pointing to your content. They improve domain authority and search visibility, and they often signal content quality.
Measured by: SEO tools that track referring domains and backlink profiles.
Website metrics
Web metrics help you understand how users interact with your site overall. They reveal how people arrive, what they do once they’re there, and how effectively your site keeps them engaged.
Pageviews
This measures how many times a page is loaded. It’s useful for understanding which pages get the most attention, though it doesn’t tell you much about quality of engagement.
Measured by: Web analytics tools like Google Analytics or Siteimprove.
Unique pageviews
Unique pageviews count how many individual users viewed a page during a session. It filters out duplicate views from the same user and gives a clearer sense of reach.
Measured by: Google Analytics or similar platforms.
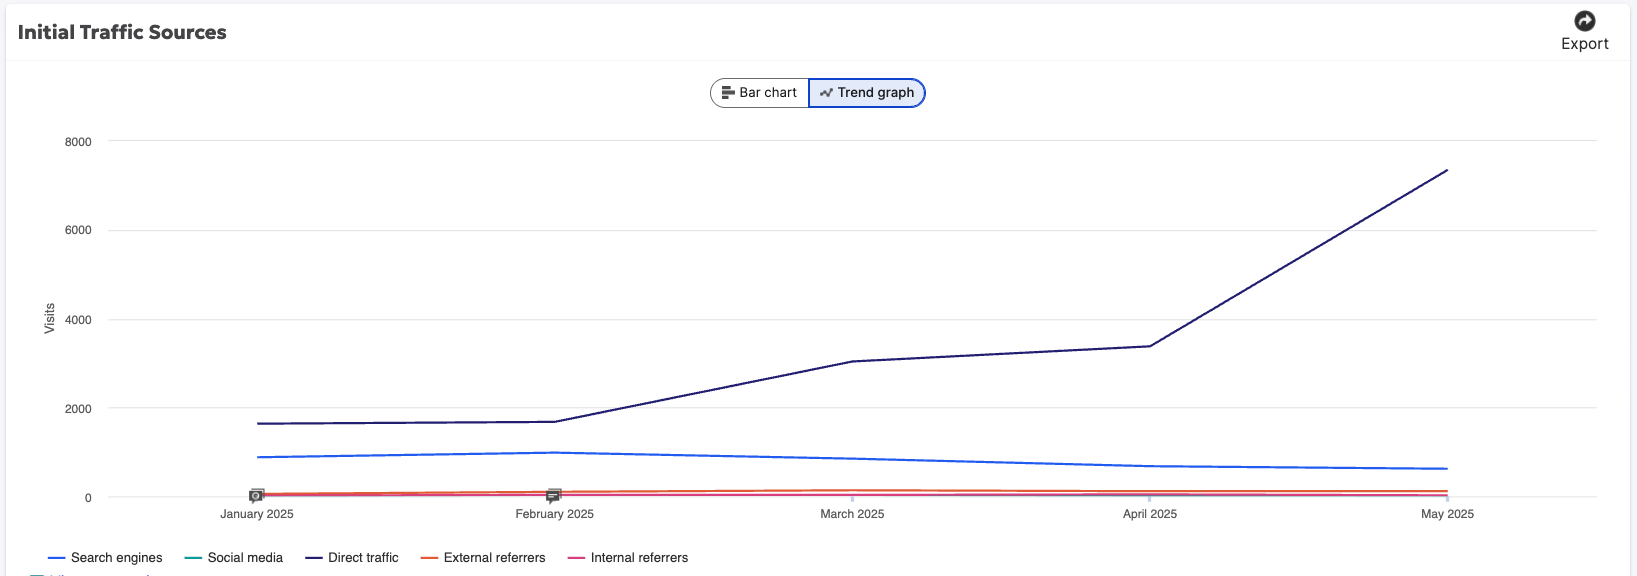
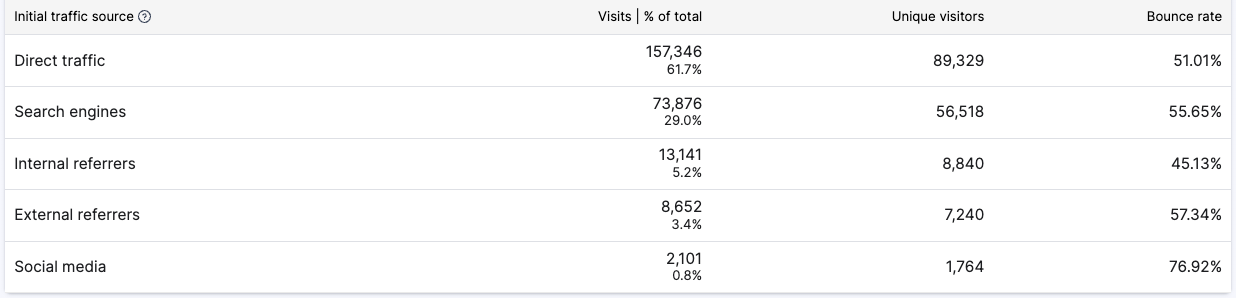
Referral traffic
Referral traffic shows how many visitors came to your site by clicking a link on another website. It helps you understand which partnerships or mentions are driving results.
Measured by: Referral reports in your analytics platform.
User/customer retention rates
This tells you how often users return to your site over time. High retention often signals valuable content and strong user experience.
Measured by: Returning visitor data or cohort analysis in analytics tools.
Average time on page
This tracks the average amount of time users spend on a page. It gives insight into how engaging or useful the content is.
Measured by: Google Analytics or Siteimprove.
Pages per session
This shows how many pages a user views during one visit. More pages per session typically suggest strong internal linking and compelling content.
Formula: Total pageviews / Total sessions
Measured by: Google Analytics or Siteimprove.
Bounce rate
Bounce rate measures the percentage of users who leave after viewing just one page. A high bounce rate can point to irrelevant content, poor UX, or slow loading times.
Formula: (Single-page sessions / Total sessions) × 100
Measured by: Google Analytics or similar platforms.
Email marketing metrics
Email metrics track the performance of your email marketing campaigns. They help you understand how well your emails are being delivered, opened, and acted on. They also show whether you're growing or losing your audience.
Email open rates
This shows the percentage of recipients who opened your email. While it can be affected by privacy settings, it’s still a general signal of subject line effectiveness and audience interest.
Formula: (Emails opened / Emails delivered) × 100
Measured by: Your email service provider (ESP)
Email bounce rate
Bounce rate tells you how many emails failed to reach inboxes. A high bounce rate could mean issues with list quality or technical setup.
Formula: (Bounced emails / Emails sent) × 100
Unsubscribe rate
This tracks how many people opted out after receiving your email. Spikes may indicate poor targeting, over-sending, or irrelevant content.
Formula: (Unsubscribes / Emails delivered) × 100
New subscribers
This measures how many new people joined your email list over a given time period. It reflects list growth and the effectiveness of your signup incentives.
Measured by: Subscriber analytics in your ESP or CRM (Customer Relationship Management platform, such as Salesforce).
Unengaged subscribers
These are users who haven’t opened or interacted with your emails in a while. Identifying them helps you clean your list or target re-engagement campaigns.
Measured by: Segment filters in your email platform.
Social media metrics
These metrics give you a snapshot of how your brand is performing across social platforms. They help you understand reach, interaction, and overall visibility.
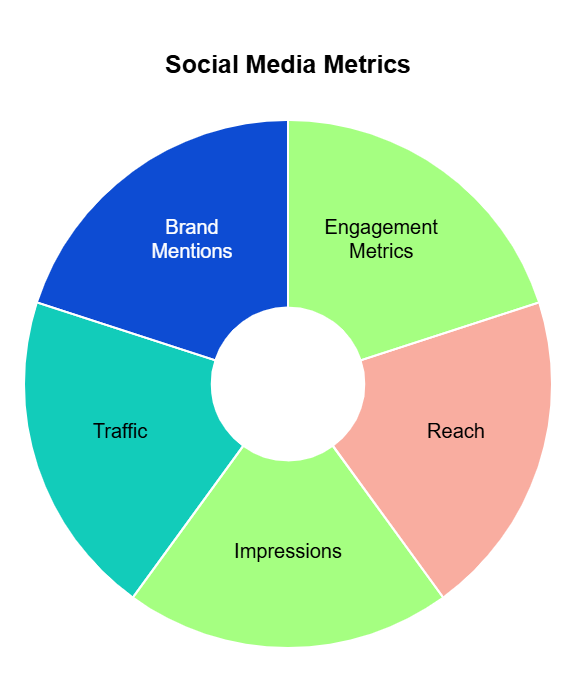
Engagement metrics
These include likes, shares, comments, and saves. High engagement means your content is resonating and encouraging interaction. You can measure these marketing metrics at the post level or for your social media program overall.
Measured by: Social media analytics tools or native platform dashboards.
Reach
Reach measures how many unique users have seen your content. It helps you assess the spread of your posts beyond your immediate followers.
Measured by: Platform insights (e.g., LinkedIn, Instagram, Facebook).
Impressions
Impressions count the total number of times your content was displayed, including repeat views. It’s useful for tracking exposure, but doesn’t indicate engagement.
Measured by: Social platform analytics.
Traffic
This shows how many users clicked from social platforms to your website. It connects your social efforts to on-site behavior and conversions.
Measured by: Google Analytics or Siteimprove Analytics using UTM tags.
Brand mentions
This tracks how often your brand is mentioned across social platforms. It helps you monitor brand awareness, reputation, and real-time engagement.
Measured by: Social listening tools like Brandwatch, Sprout Social, or Hootsuite.
Retention metrics
Retention metrics help you understand how well you're keeping customers and generating value from your existing base. They're critical for measuring long-term growth and brand loyalty.
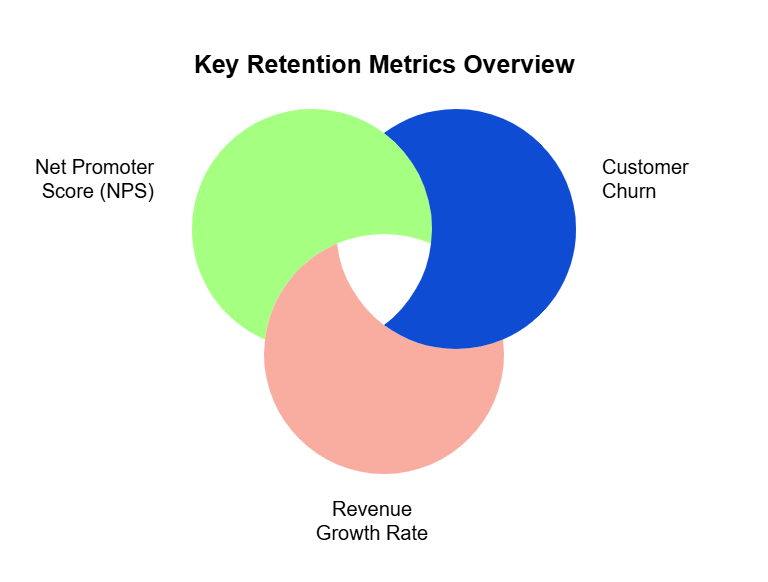
Customer churn
Churn rate shows how many customers you lose over a period of time. A high churn rate can point to product, service, or communication issues.
Formula: (Customers lost / Total customers at start of period) × 100
Revenue growth rate of existing customers
This tracks how much additional revenue you're generating from your current customer base through upsells, renewals, or increased usage.
Measured by: CRM or revenue tracking platforms
Net promoter score (NPS)
NPS measures how likely customers are to recommend your brand to others. It’s a leading indicator of customer satisfaction and loyalty.
Formula: Percent of promoters – Percent of detractors (based on 0–10 survey responses).
Tools that make measurement actionable
Tracking metrics is only useful if you can do something with them. That’s why the right tools — and how you use them — matter just as much as the data itself.
Start by building dashboards that surface the metrics tied to your goals. These should give you a real-time view of what’s working, what’s slipping, and where to focus next.
It’s fine if only a few marketing metrics are relevant to you. Every business is different. If only a handful of data points inform your decisions, don't stress yourself with more.
Then set up automated alerts so you’re notified if your tracked metrics behave unexpectedly. This helps you respond fast without constantly checking dashboards.
This one’s critical: Choose a tool that unifies your data across marketing, sales, and product. It’s much easier to understand your business’ performance (and how to improve it) when you can see everything in one place. (Cross-channel data silos are the bane of just about every marketer’s existence, so you want to avoid them at all costs.)
Furthermore, create transparency across your entire organization by giving everyone access to the data. Break down silos so team members can see how their work influences other teams. This makes it easier to align strategies and avoid confusion, and it makes reporting marketing metrics to your leadership team a stress-free cinch.
For example, a cross-functional scorecard that’s tied to pipeline and revenue can help teams stay focused on shared outcomes, not just their siloed performance. When those in the trenches and those higher up in the organization can see the big picture at a glance, confusion is automatically reduced (and moods tend to be elevated, too).
That’s where Siteimprove comes in. It brings all your essential marketing metrics into one unified platform so you can track performance, spot issues, and take action without switching among tools.
With real-time dashboards, automated alerts, and easy integrations across departments, Siteimprove keeps your team aligned. Whether you're monitoring SEO, web performance, accessibility, or conversions, it gives you clarity to make better decisions.
Another bonus? Siteimprove is intuitive, so you don’t have to be an expert to understand what’s going on. Limited team skills and resource constraints become less of an issue the more intuitive a platform is.
Track, act, and set yourself up for the future
The goal isn’t to collect more data. It’s to make better decisions. Measuring the right things gives your team clarity. When your data is tied to real goals, it becomes a tool for decision-making.
Much as you want to see short-term results, you also want to be poised for what’s coming down the pike. AI-driven analytics, predictive marketing, and real-time measurement are only going to get more sophisticated with time, so when you’re evaluating platforms, look for those that promise to keep ahead of the curve by actively integrating technological advancements.
The more you can trust your software vendor to keep up with the latest and greatest in terms of technological innovations (including AI), the better primed you are to focus on strategy that’s particular to your organization. Ultimately, your competitive edge lies in shedding time-consuming activities that keep team members deep in the weeds rather than focused on the big picture.
Advanced tools like Siteimprove do double duty: They keep up with your immediate needs and they are always a step ahead in terms of what is possible (and smart) from a technical perspective. That’s how you turn data into momentum.