ANALYTICS
Better conversion insights, made easy
Too much data, too little direction. Siteimprove.ai unifies analytics from all channels, paid, organic, website, social, into one marketer‑friendly platform. Get clear visibility into campaign ROI, visitor behavior, and high-impact opportunities, so decisions get smarter, faster.
Request a demo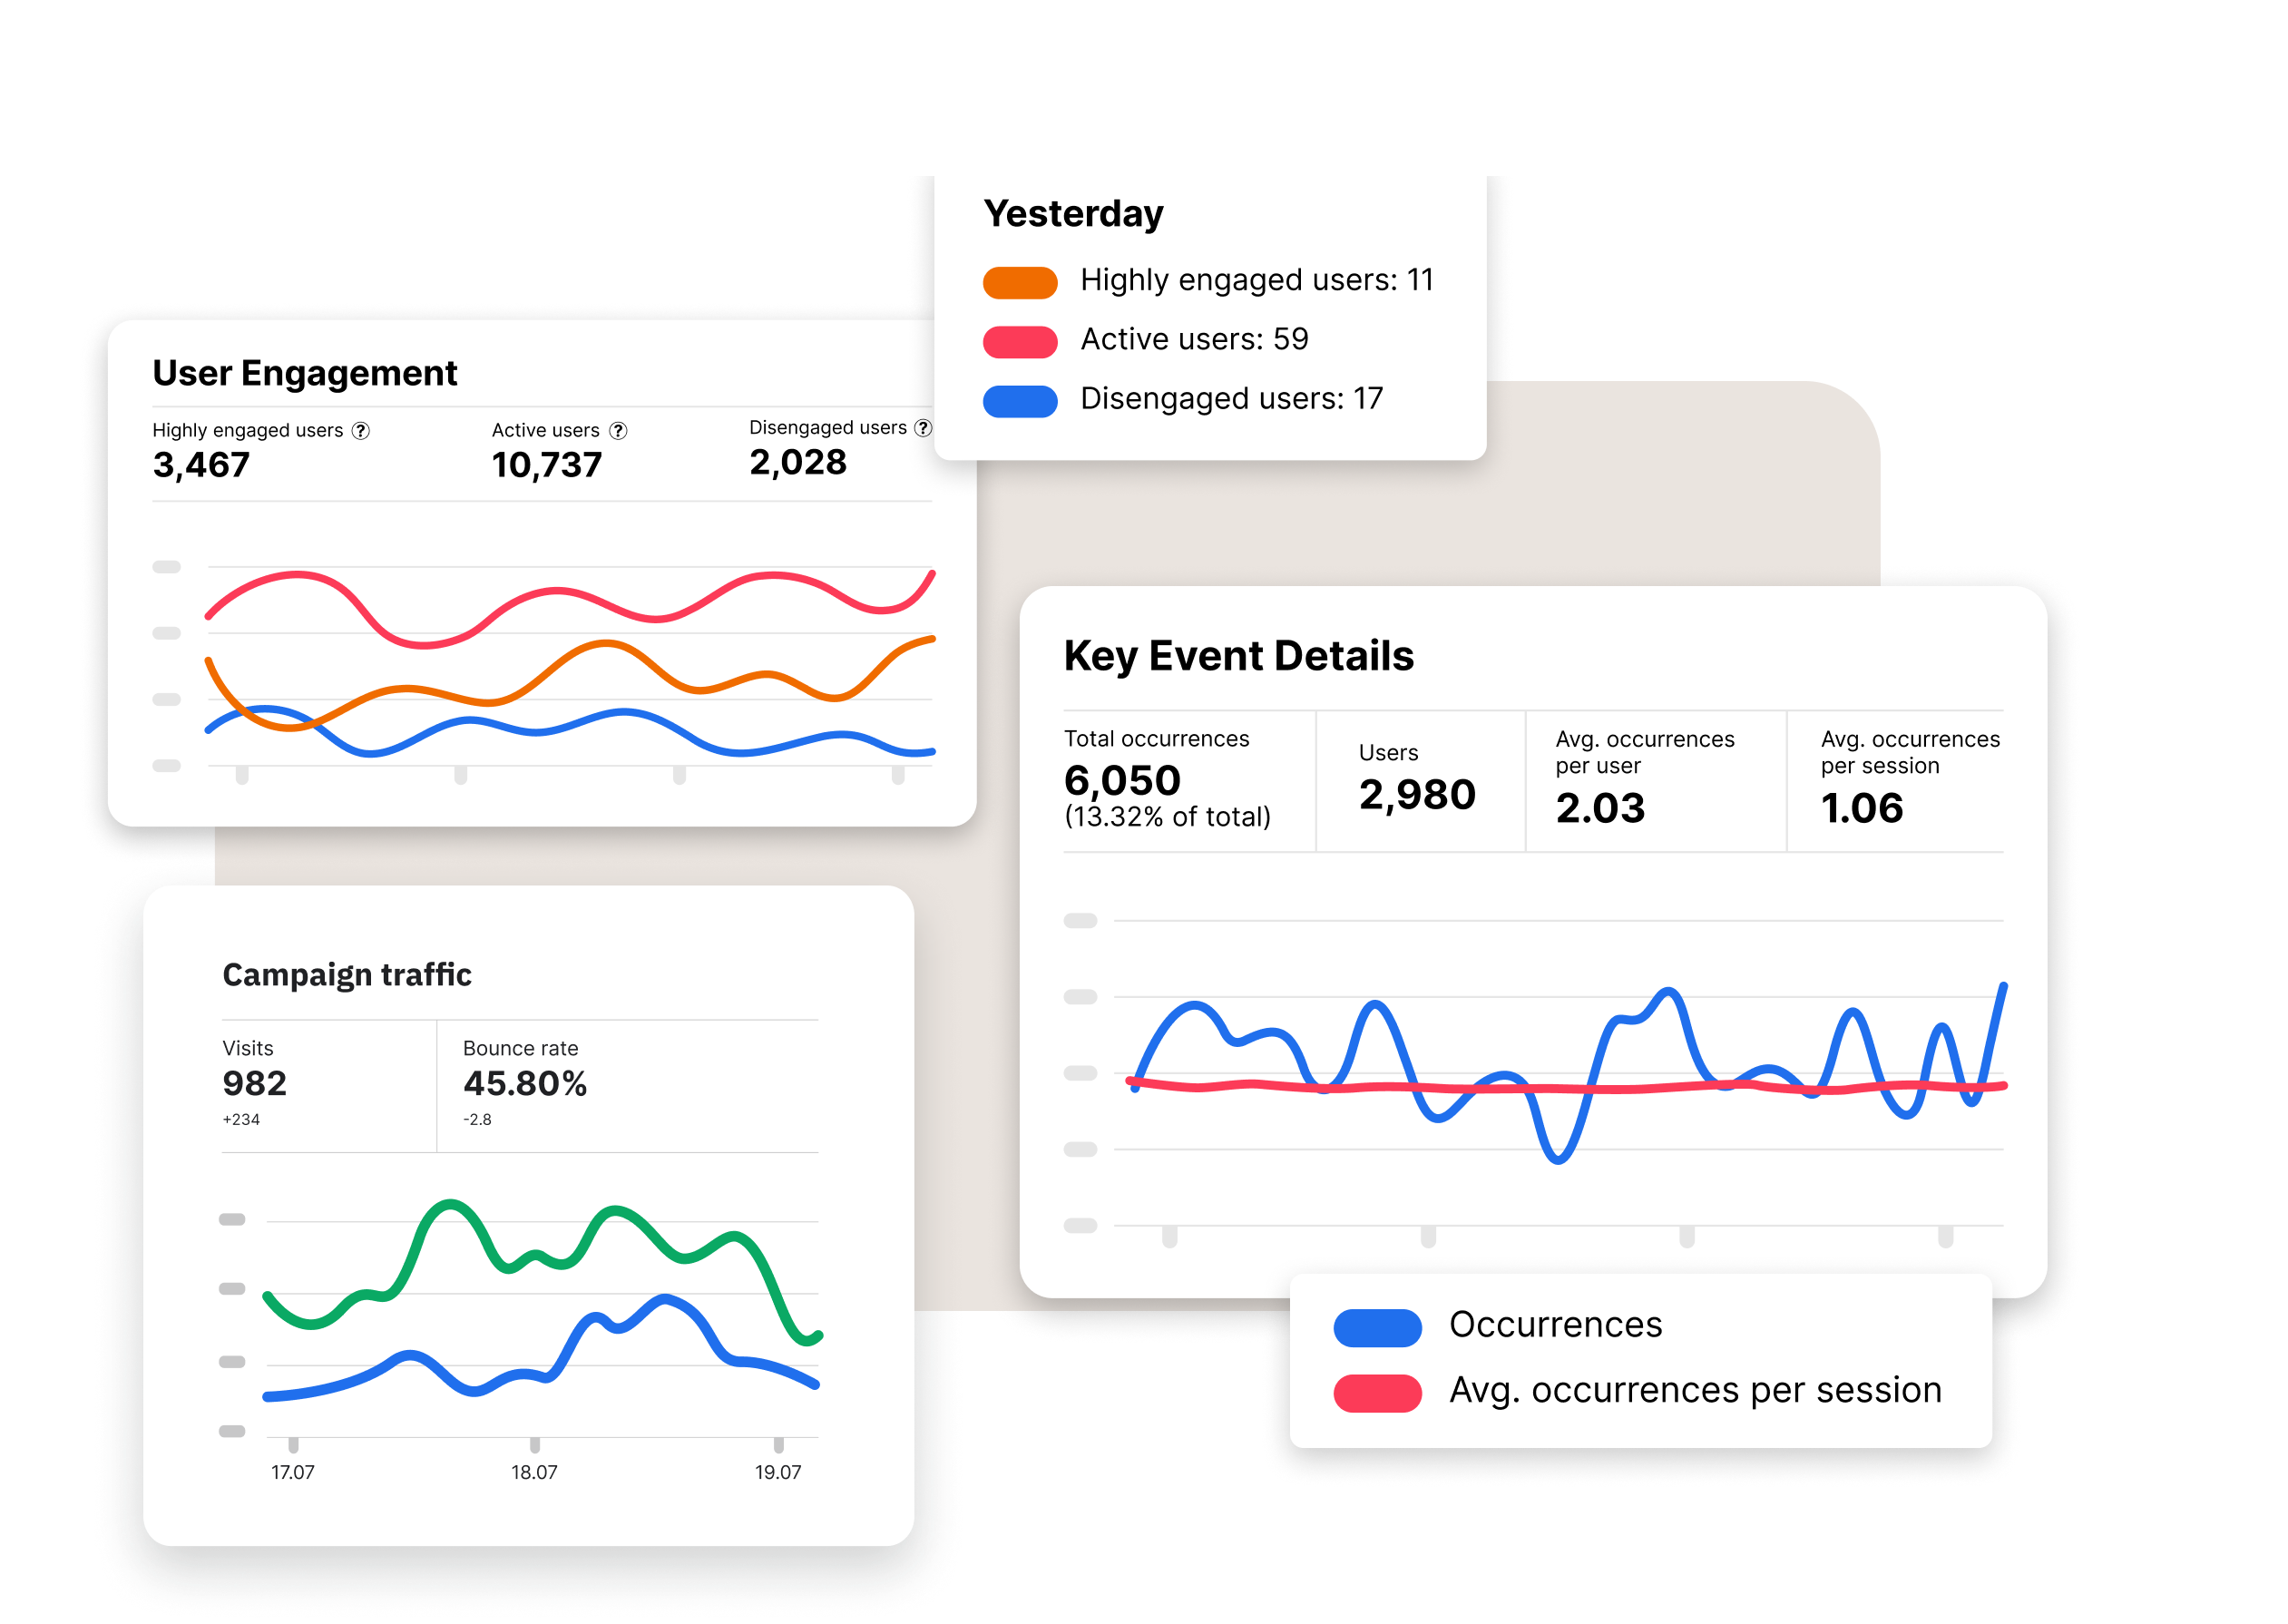
Protecting the brand integrity of global leaders


You can’t improve what you can’t see.
Fragmented dashboards and siloed analytics leave you guessing. Without a full view of how users interact across content, channels, and campaigns, you can’t pinpoint where conversions are lost, which investments are misaligned, or how to link marketing to real business performance. That leads to wasted spend and no clear path to improve.

Tailored customer journeys unlock results
"Since the relaunch, we were able to quadruple traffic to our website and gain deep data-driven insights into the mechanics of content design, which will guide our digital marketing efforts moving forward."
Jörg Lothal
Senior Manager Corporate Communications
Intelligence & SEM at Merck
Read the case studyLearn how marketing teams use Siteimprove.ai to turn fragmented digital data into actionable analytics
Discover how a six-person team manages
thousands of pages with efficient
QA and accessibility workflows.
Learn how Community First Credit Union boosted
website health by 55% and SEO scores by 22 points.
See how Posten Bring replaced siloed tools
and scaled SEO and analytics across four countries.
Siteimprove.ai is an agentic content intelligence platform that brings together accessibility, analytics, SEO, and content strategy into a single, continuous flow.

Web accessibility
Accessibility drives marketing performance. Siteimprove helps you build inclusive foundations that set you up for success.
Explore web accessibilityMobile accessibility
Your mobile apps deserve the same level of accessibility and polish as your websites. With Siteimprove’s mobile testing tools, your team can identify and resolve issues early, with no source code or complex setup required.
Explore mobile accessibilityMarketing analytics
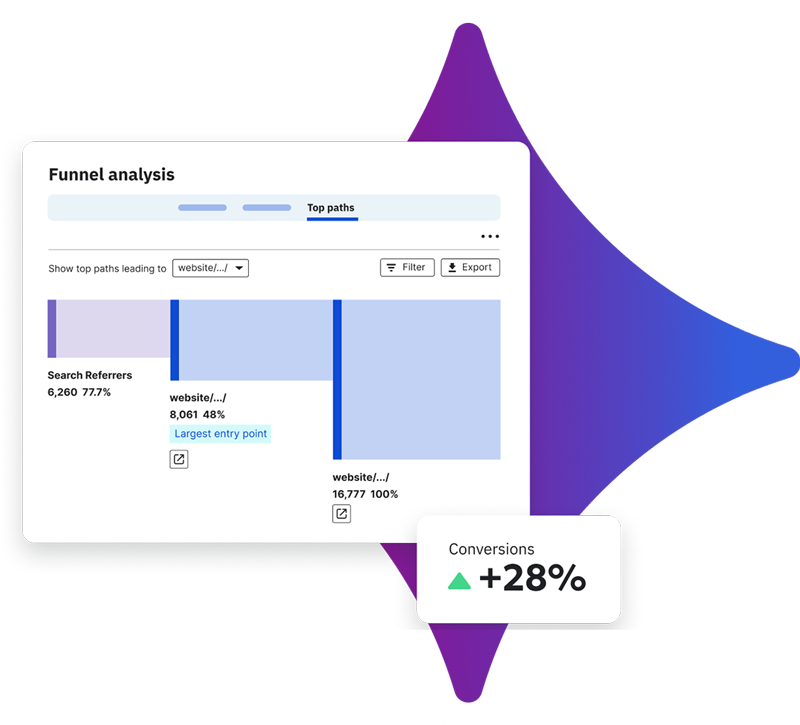
Go beyond simple traffic metrics and connect your marketing activities to real business outcomes. Get a comprehensive view of user behavior, track campaign performance, and understand content effectiveness. Prove the ROI of your marketing efforts quickly and easily.
Explore marketing analyticsPaid search analytics
Stop wasting your budget on underperforming campaigns. Siteimprove provides the deep analysis you need to optimize your Quality Score, improve landing page effectiveness, and make smarter decisions that increase conversions and lower your cost-per-acquisition.
Explore paid search analyticsApp analytics
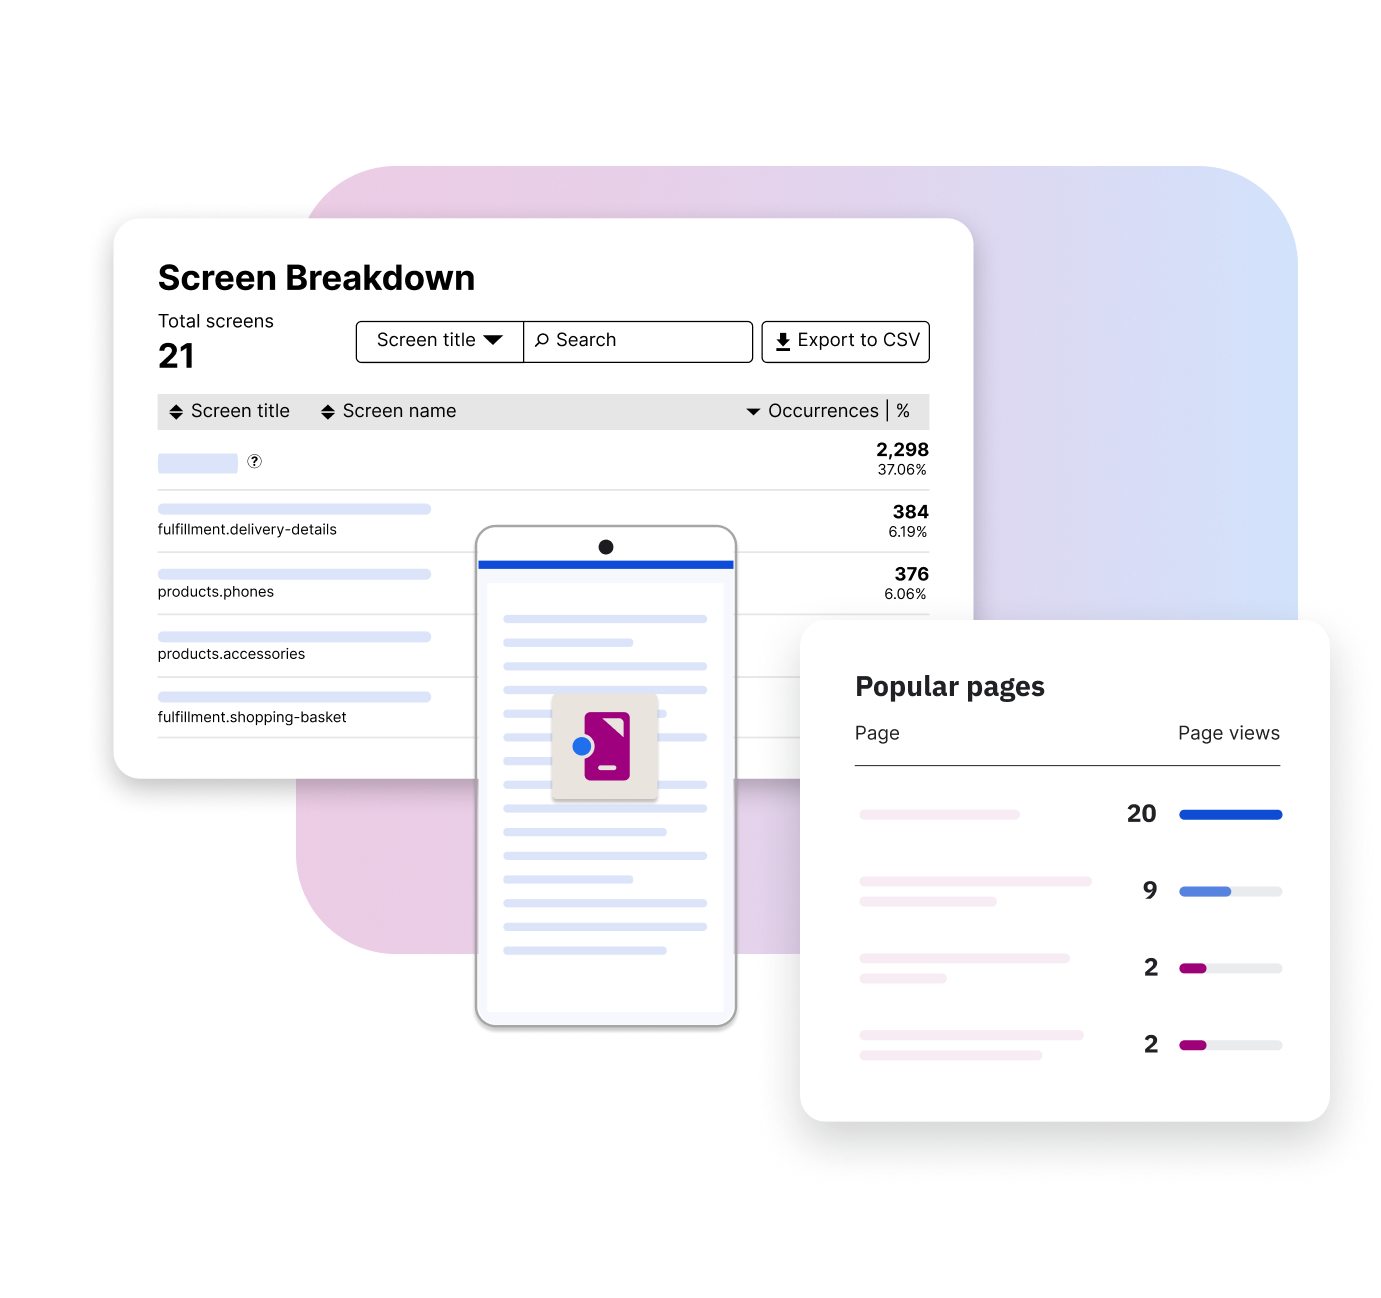
Get the full picture across your digital properties. Track and improve user engagement across both native apps and websites in one unified workspace, without juggling separate tools or data sources.
Explore app analyticsTechnical SEO & auditing tools
Your content and brand investments are only as strong as your website's technical foundation. Our platform helps find, prioritize, and fix the critical technical errors that undermine rankings and erode user trust. It’s the best way to ensure that your marketing efforts deliver their full impact.
Explore technical SEOSEO analytics & intelligence
Go beyond basic rank tracking. Our platform provides the deep competitive intelligence and performance data you need to uncover hidden opportunities, report on the impact of your SEO efforts, and protect your organic traffic.
Explore SEO analyticsWebsite auditing tool
Broken links, slow-loading pages, and simple typos erode customer trust and damage your brand. Our platform continuously audits your entire website for technical quality issues, so your team can find and fix the frustrating errors that stand between you and your customers.
Explore website auditingContent strategy & planning platform
Stop creating content based on guesswork. Our platform transforms your content creation process, helping you build a predictable, high-performing content engine on a foundation of data-driven strategy.
Explore content strategyContent optimization
Turn your content creators into SEO powerhouses with our SEO Intelligence Suite. Our platform provides real-time, data-driven feedback directly within the writing process, so your team can optimize every article for search performance before you ever hit "publish."
Explore content optimizationContent governance & brand compliance
Imagine it: Every piece of content perfectly reflects your brand standards. Our platform automates the enforcement of your brand, style, and legal policies, giving you a scalable way to maintain consistency and protect your brand's integrity across your entire digital presence while reducing manual review cycles and protecting brand integrity.
Explore content governanceA unified platform for your entire team

Marketing leader
Confidently answer "What's the ROI?" with clear, credible reports that connect marketing spend to business outcomes and justify future investment.

Content marketer
Get a comprehensive view of campaign performance across all channels, allowing you to optimize your strategy and allocate budget effectively.

Performance marketer
Move from data wrangler to strategic advisor by using a powerful, intuitive platform to uncover deep insights into user behavior and content effectiveness.
See how Siteimprove Analytics performs in your industry
Siteimprove Analytics doesn’t live in a vacuum—it helps real teams in highly regulated, complex environments make better digital decisions every day. Explore how organizations like yours use analytics insights to improve experiences and prove impact.
Healthcare
See how healthcare marketing and digital teams use Siteimprove Analytics to improve patient journeys while staying aligned with strict accessibility and compliance requirements.
Financial services
Learn how banks, credit unions, and financial institutions use analytics to tighten governance, reduce digital risk, and connect web behavior to high-value customer journeys.
Marketing analytics platform FAQs
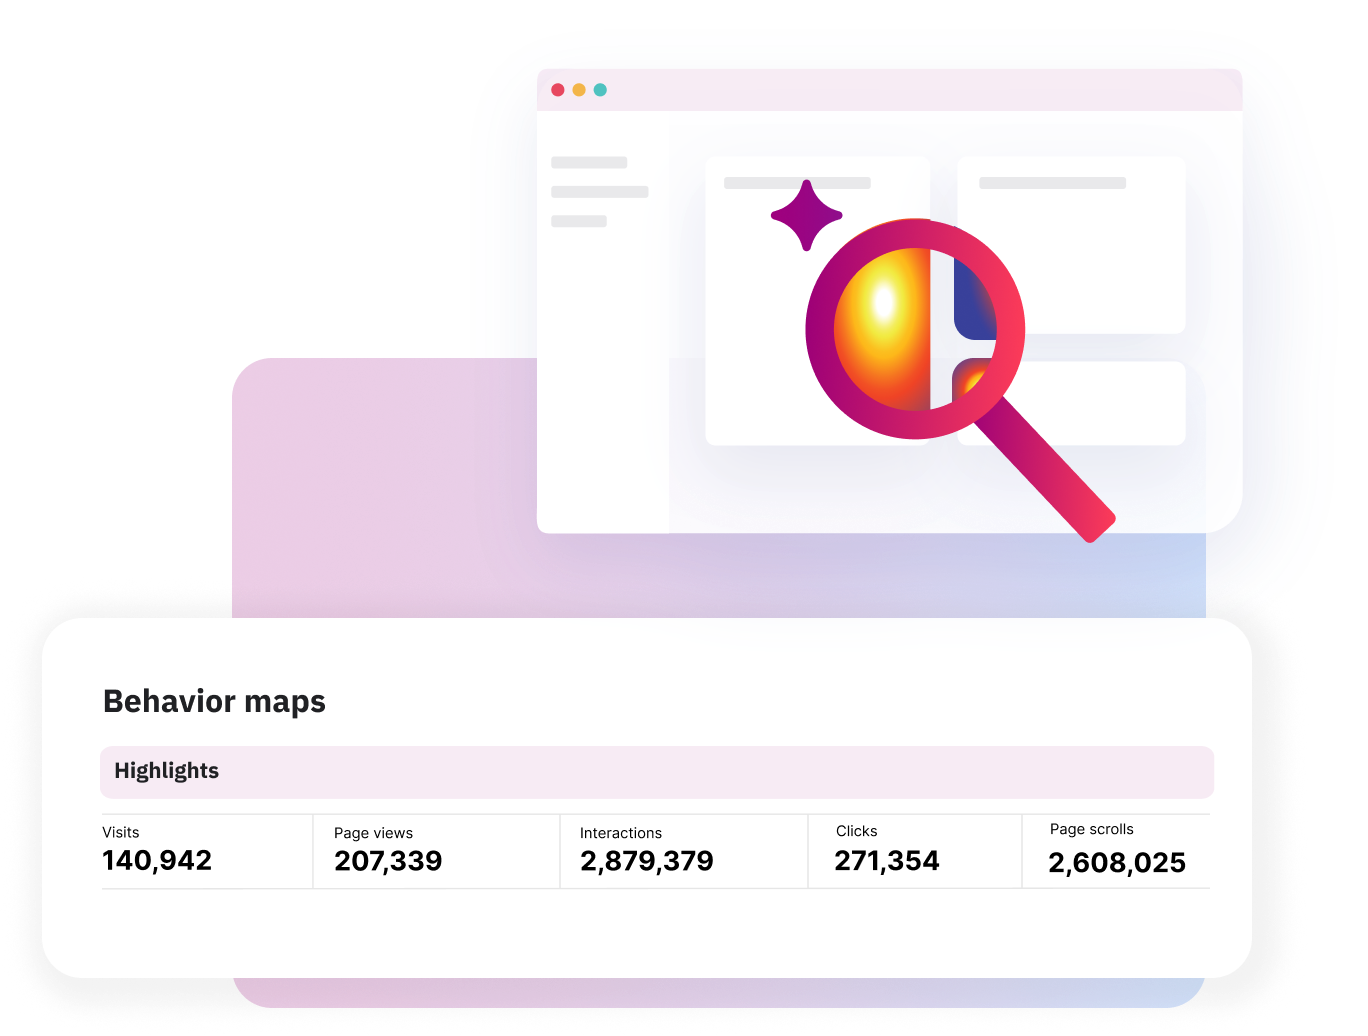
GA4 is a powerful tool for measuring web traffic. Our platform is a comprehensive marketing analytics solution designed to help you make strategic decisions. We provide a more complete and unsampled dataset, deeper user behavior tools like heatmaps, and critically, we integrate analytics with our other platform capabilities. This allows you to not only see that a page has low traffic but also diagnose the SEO or accessibility issues causing the problem, all in one place.
Yes. Our platform currently uses a last-click attribution model, which attributes conversions to the final interaction in the customer journey. This gives you a clear understanding of which touchpoint ultimately drove the conversion.
No, it's designed for the entire marketing team. While powerful enough for a dedicated analyst, the intuitive interface and customizable dashboards make it easy for marketers and leaders to get the data they need without specialized technical knowledge. We also provide dedicated onboarding and support to ensure your team is set up for success.
Absolutely. The platform is built for flexibility. You can easily set up and track custom goals, events, and conversions that align directly with your specific business objectives, whether that's lead form submissions, e-commerce transactions, or downloads of a key piece of content.